
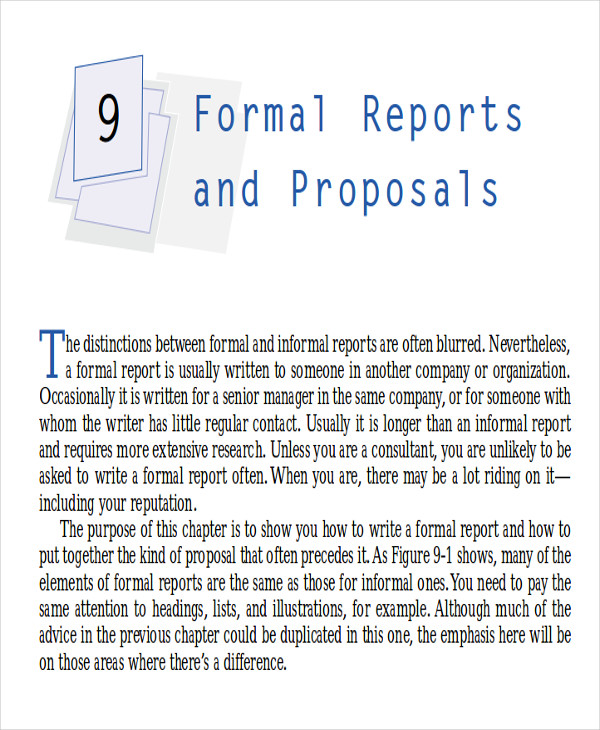
At some point, it is most likely that you were asked to make a report. If not for work, you were definitely asked to write one for school. It could be a case study, a research report, or a narrative report, chances are you have made some kind of report. Making a report would require you a lot of time and research as you can’t just make a report out of nowhere. You have to have quantifiable data to back it up.
When making these reports, there are often formatting rules that you have to follow. There are certain elements that should be included in there. This adds to the work that you have to do. Fortunately, you won’t have to worry about that with our sample report format.
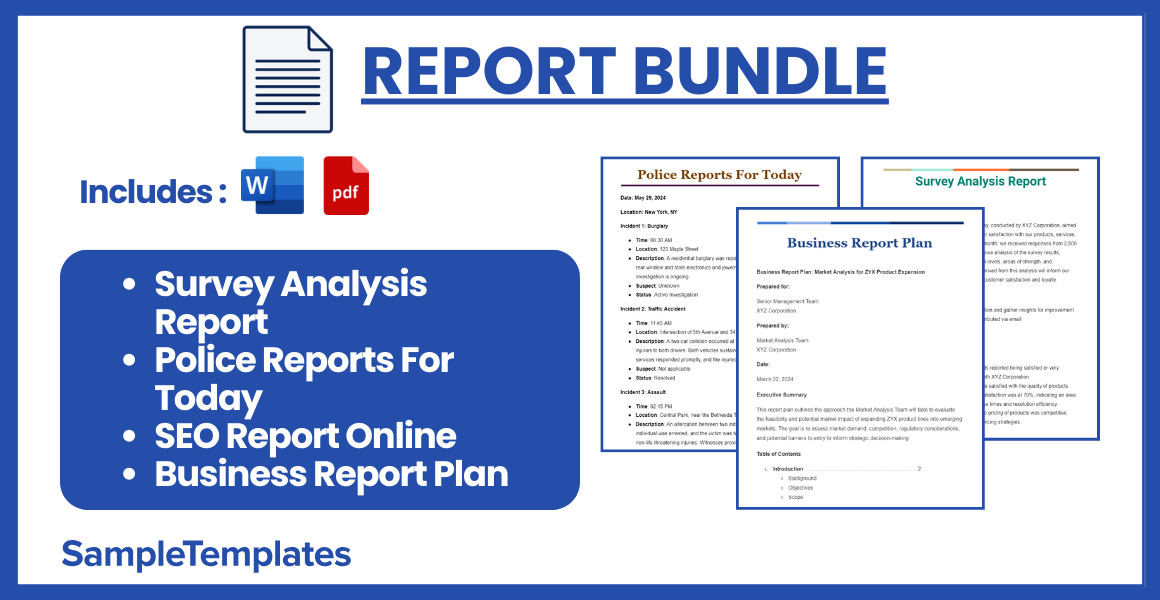
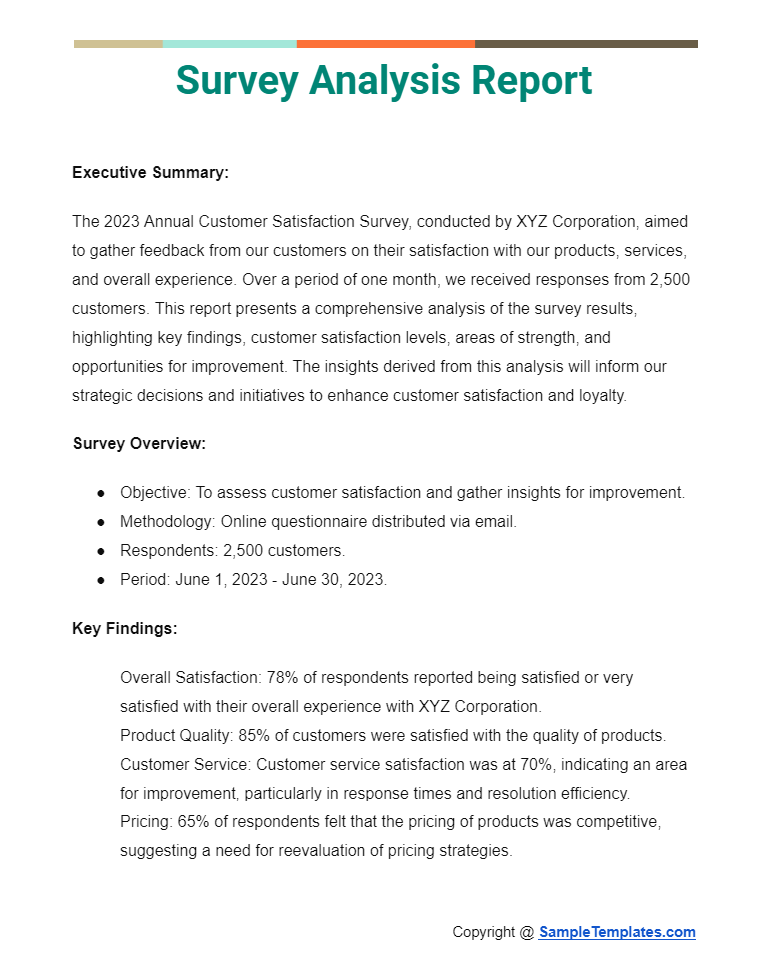
Survey Analysis Report
Executive Summary:
The 2023 Annual Customer Satisfaction Survey, conducted by XYZ Corporation, aimed to gather feedback from our customers on their satisfaction with our products, services, and overall experience. Over a period of one month, we received responses from 2,500 customers. This report presents a comprehensive analysis of the survey results, highlighting key findings, customer satisfaction levels, areas of strength, and opportunities for improvement. The insights derived from this analysis will inform our strategic decisions and initiatives to enhance customer satisfaction and loyalty.
Survey Overview:
- Objective: To assess customer satisfaction and gather insights for improvement.
- Methodology: Online questionnaire distributed via email.
- Respondents: 2,500 customers.
- Period: June 1, 2023 – June 30, 2023.
Key Findings:
- Overall Satisfaction: 78% of respondents reported being satisfied or very satisfied with their overall experience with XYZ Corporation.
- Product Quality: 85% of customers were satisfied with the quality of products.
- Customer Service: Customer service satisfaction was at 70%, indicating an area for improvement, particularly in response times and resolution efficiency.
- Pricing: 65% of respondents felt that the pricing of products was competitive, suggesting a need for reevaluation of pricing strategies.
- Website Usability: 80% satisfaction rate, highlighting the effectiveness of the recent website redesign.
Areas of Strength:
- High product quality satisfaction indicates that our investment in quality control and product development is paying off.
- The positive feedback on website usability demonstrates success in our efforts to create a user-friendly online experience.
Areas for Improvement:
- Customer service has been identified as a primary area requiring attention, with a focus on training staff and streamlining processes to improve response times and resolution rates.
- Reassessing pricing strategies to enhance competitiveness and value perception among our customer base.
Customer Feedback Highlights:
Several customers praised the durability and innovation of our products, while others requested more variety in product offerings. The need for more personalized customer service was a recurring theme in the feedback.
Recommendations:
- Enhance Customer Service: Implement a training program for customer service staff and introduce a more efficient ticketing system to reduce response times.
- Review Pricing Strategies: Conduct a market analysis to adjust pricing and introduce more flexible pricing options where feasible.
- Expand Product Range: Research customer demand for new product lines to diversify our offerings.
Conclusion:
The 2023 Annual Customer Satisfaction Survey has provided valuable insights into the perceptions and needs of our customers. By addressing the identified areas for improvement, XYZ Corporation can build on its strengths to further enhance customer satisfaction and loyalty, driving sustainable growth and success in the competitive market.
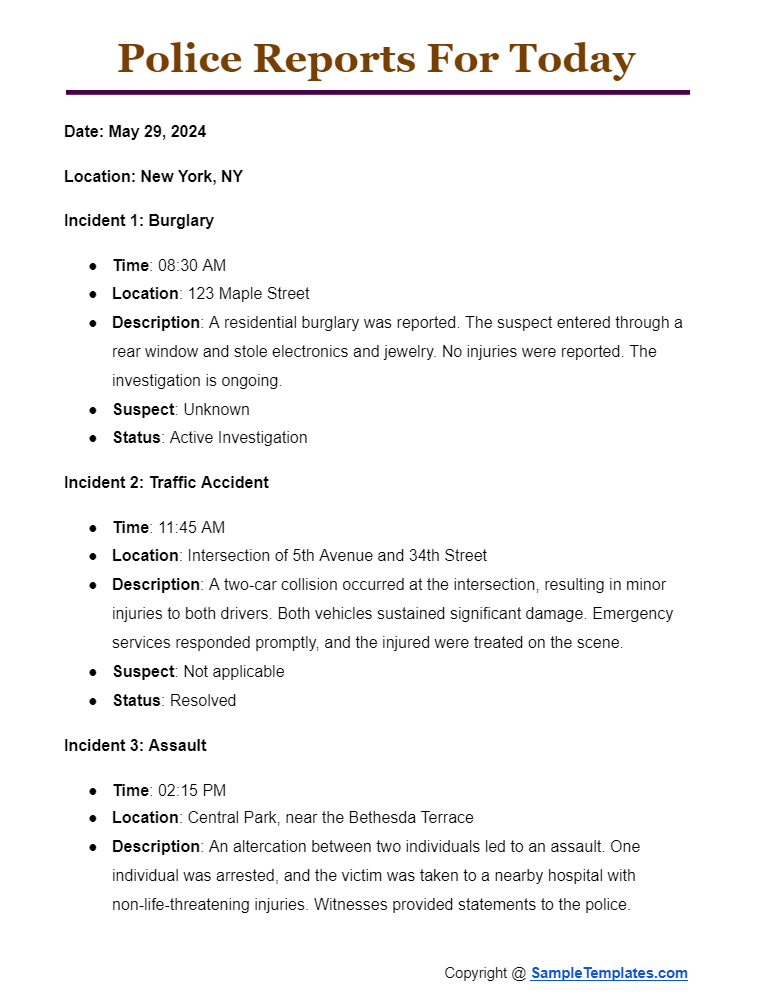
Police Reports For Today
Date: May 29, 2024
Location: New York, NY
Incident 1: Burglary
- Time: 08:30 AM
- Location: 123 Maple Street
- Description: A residential burglary was reported. The suspect entered through a rear window and stole electronics and jewelry. No injuries were reported. The investigation is ongoing.
- Suspect: Unknown
- Status: Active Investigation
Incident 2: Traffic Accident
- Time: 11:45 AM
- Location: Intersection of 5th Avenue and 34th Street
- Description: A two-car collision occurred at the intersection, resulting in minor injuries to both drivers. Both vehicles sustained significant damage. Emergency services responded promptly, and the injured were treated on the scene.
- Suspect: Not applicable
- Status: Resolved
Incident 3: Assault
- Time: 02:15 PM
- Location: Central Park, near the Bethesda Terrace
- Description: An altercation between two individuals led to an assault. One individual was arrested, and the victim was taken to a nearby hospital with non-life-threatening injuries. Witnesses provided statements to the police.
- Suspect: John Doe (arrested)
- Status: Suspect in custody
Incident 4: Theft
- Time: 04:00 PM
- Location: 456 Broadway
- Description: A shoplifting incident was reported at a local retail store. The suspect stole clothing items and fled the scene. Security footage is being reviewed to identify the suspect.
- Suspect: Unknown
- Status: Active Investigation
Incident 5: Vandalism
- Time: 06:30 PM
- Location: 789 Pine Street
- Description: A case of vandalism was reported at a public park. Several benches and playground equipment were damaged. Authorities are seeking information from the public to identify the perpetrators.
- Suspect: Unknown
- Status: Active Investigation.
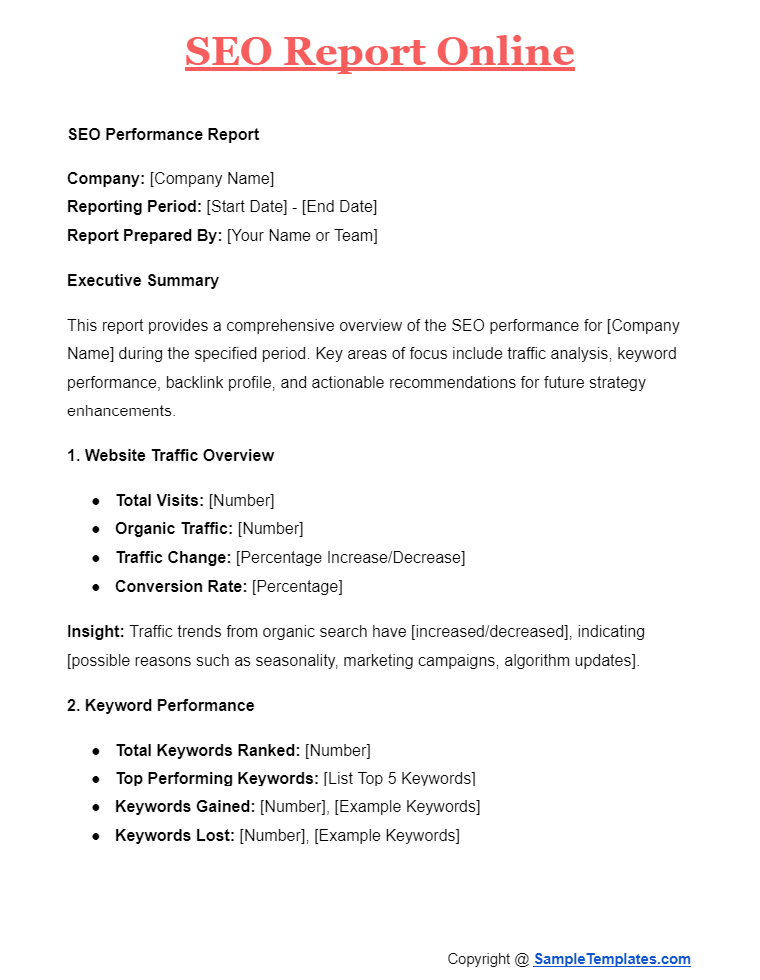
SEO Report Online
SEO Performance Report
Company: [Company Name]
Reporting Period: [Start Date] – [End Date]
Report Prepared By: [Your Name or Team]
Executive Summary
This report provides a comprehensive overview of the SEO performance for [Company Name] during the specified period. Key areas of focus include traffic analysis, keyword performance, backlink profile, and actionable recommendations for future strategy enhancements.
1. Website Traffic Overview
- Total Visits: [Number]
- Organic Traffic: [Number]
- Traffic Change: [Percentage Increase/Decrease]
- Conversion Rate: [Percentage]
Insight: Traffic trends from organic search have [increased/decreased], indicating [possible reasons such as seasonality, marketing campaigns, algorithm updates].
2. Keyword Performance
- Total Keywords Ranked: [Number]
- Top Performing Keywords: [List Top 5 Keywords]
- Keywords Gained: [Number], [Example Keywords]
- Keywords Lost: [Number], [Example Keywords]
Insight: The shift in keyword rankings suggests [analysis, e.g., the impact of recent content updates or competitors’ actions].
3. Page Performance
- Top Pages by Traffic: [List Top 5 URLs]
- Average Time on Page: [Average Time]
- Bounce Rate: [Percentage]
Insight: High-performing pages [discuss why they perform well, such as quality content, effective SEO practices] while pages with high bounce rates may need [suggestions for improvement].
4. Backlink Analysis
- Total Backlinks: [Number]
- New Backlinks Acquired: [Number]
- Lost Backlinks: [Number]
- Top Referring Domains: [List Top 5 Domains]
Insight: The backlink profile has [improved/deteriorated], influencing domain authority and search rankings. Focus on [strategies to improve backlinks, such as content marketing or outreach].
5. Technical SEO Audit
- Site Speed: [Average Load Time]
- Mobile Usability: [Issues Found/None]
- SEO Errors: [List Critical Errors]
Insight: Technical issues such as [list issues] could be negatively impacting user experience and SERP rankings. Immediate action is recommended.
6. Competitor Benchmarking
- Primary Competitors: [List Competitors]
- Competitor Keyword Overlap: [Details]
- Competitor Traffic Estimate: [Comparison]
Insight: Understanding competitor strategies in [mention specific areas such as content or backlinks] can uncover opportunities for differentiation and growth.
7. Recommendations and Next Steps
- Keyword Optimization: Focus on [specific actions].
- Content Development: Increase efforts in [specific types of content].
- Link Building: Enhance backlink profile by [specific methods].
- Technical Improvements: Address [specific issues] immediately.
Conclusion
Overall, [Company Name]’s SEO performance has shown [positive/negative/stable] trends. By addressing the outlined areas for improvement and continuing to build on current strengths, we can further enhance our online visibility and search engine rankings
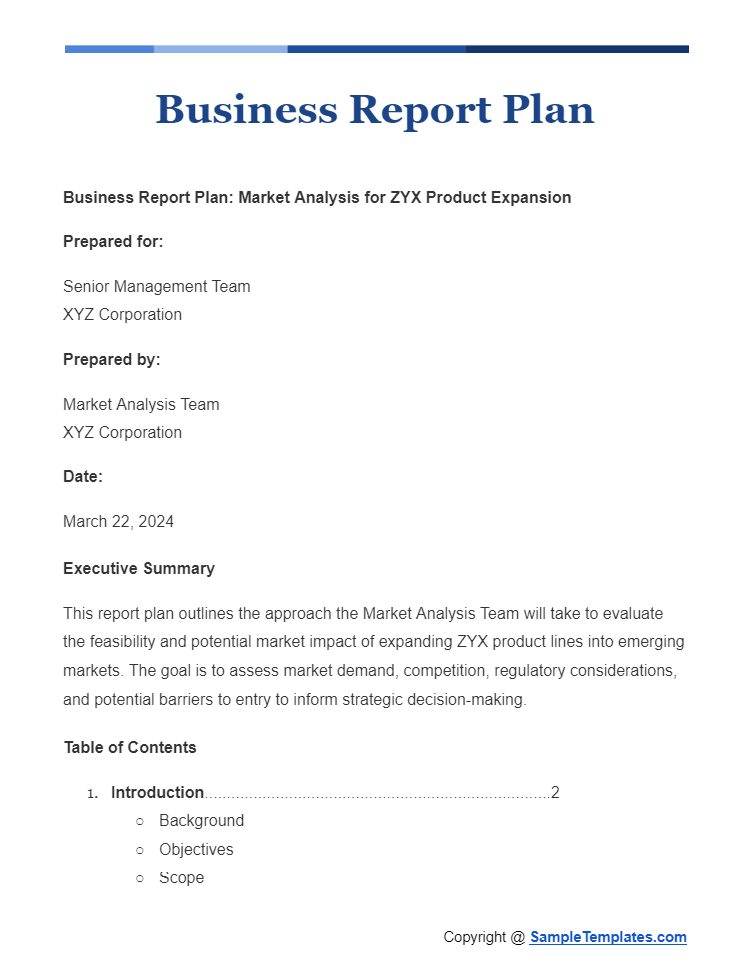
Business Report Plan
Business Report Plan: Market Analysis for ZYX Product Expansion
Prepared for:
Senior Management Team
XYZ Corporation
Prepared by:
Market Analysis Team
XYZ Corporation
Date:
March 22, 2024
Executive Summary
This report plan outlines the approach the Market Analysis Team will take to evaluate the feasibility and potential market impact of expanding ZYX product lines into emerging markets. The goal is to assess market demand, competition, regulatory considerations, and potential barriers to entry to inform strategic decision-making.
Table of Contents
- Introduction……………………………………………………………………2
- Background
- Objectives
- Scope
- Methodology…………………………………………………………………..3
- Research Methods
- Data Sources
- Market Analysis………………………………………………………………4
- Market Demand
- Competitive Analysis
- Regulatory Environment
- SWOT Analysis………………………………………………………………..5
- Strengths
- Weaknesses
- Opportunities
- Threats
- Risk Assessment……………………………………………………………..6
- Market Entry Risks
- Operational Risks
- Financial Projections………………………………………………………..7
- Initial Investment
- Revenue Forecasts
- Profit Margins
- Recommendations…………………………………………………………..8
- Strategic Recommendations
- Implementation Plan
- Conclusion…………………………………………………………………….9
- References…………………………………………………………………..10
- Appendices…………………………………………………………………11
- Appendix A: Detailed Market Research Findings
- Appendix B: Financial Models and Projections
Introduction
- Background: XYZ Corporation has identified potential growth opportunities for its ZYX product line in several emerging markets. This expansion aligns with the company’s strategic goals of diversifying its market presence and driving growth.
- Objectives: To conduct a comprehensive market analysis to evaluate the viability of expanding the ZYX product line into selected emerging markets.
- Scope: The report will cover market demand, competition, regulatory challenges, and financial viability related to the expansion.
Methodology
- Research Methods: The team will employ a mix of qualitative and quantitative research methods, including market surveys, competitor analysis, and regulatory review.
- Data Sources: Information will be gathered from industry reports, government publications, and direct surveys of potential customers.
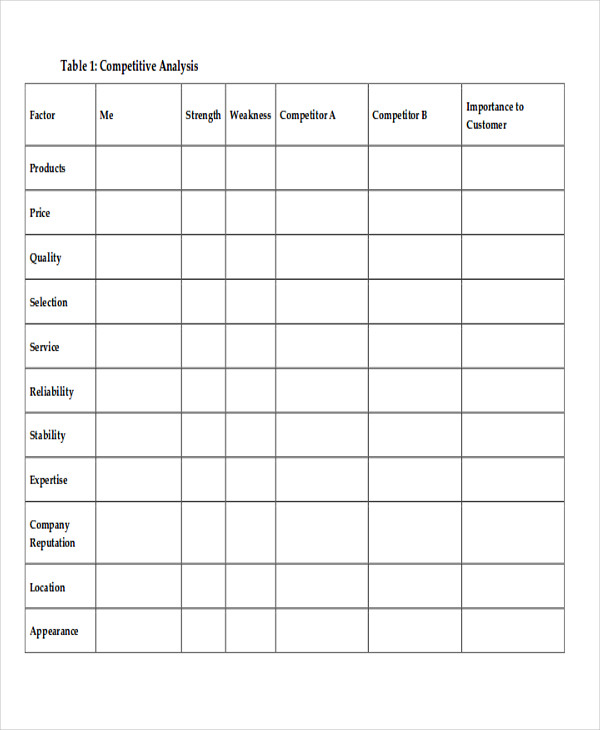
Market Analysis
- Market Demand: Assessment of current demand and future growth potential for ZYX products in the target markets.
- Competitive Analysis: Evaluation of direct and indirect competitors, their market share, and strategies.
- Regulatory Environment: Overview of the regulatory landscape, including any barriers to entry and compliance requirements.
SWOT Analysis
Comprehensive SWOT analysis to identify the internal strengths and weaknesses of XYZ Corporation, as well as the external opportunities and threats that could impact the expansion project.
Risk Assessment
- Market Entry Risks: Identification of potential risks associated with market entry, including cultural, economic, and political factors.
- Operational Risks: Assessment of risks related to operations, supply chain, and logistics in the new markets.
Financial Projections
Detailed projections of the initial investment required, expected revenue growth, and profitability of the ZYX product expansion into emerging markets.
Recommendations
Strategic recommendations based on the analysis and findings, including an implementation plan outlining the steps XYZ Corporation should take to successfully enter the target markets.
Conclusion
A summary of the key findings, implications for XYZ Corporation, and the proposed next steps for the ZYX product line expansion.
References
A list of all sources used in the preparation of this report plan.
Appendices
- Appendix A: Detailed Market Research Findings
- Appendix B: Financial Models and Projections.
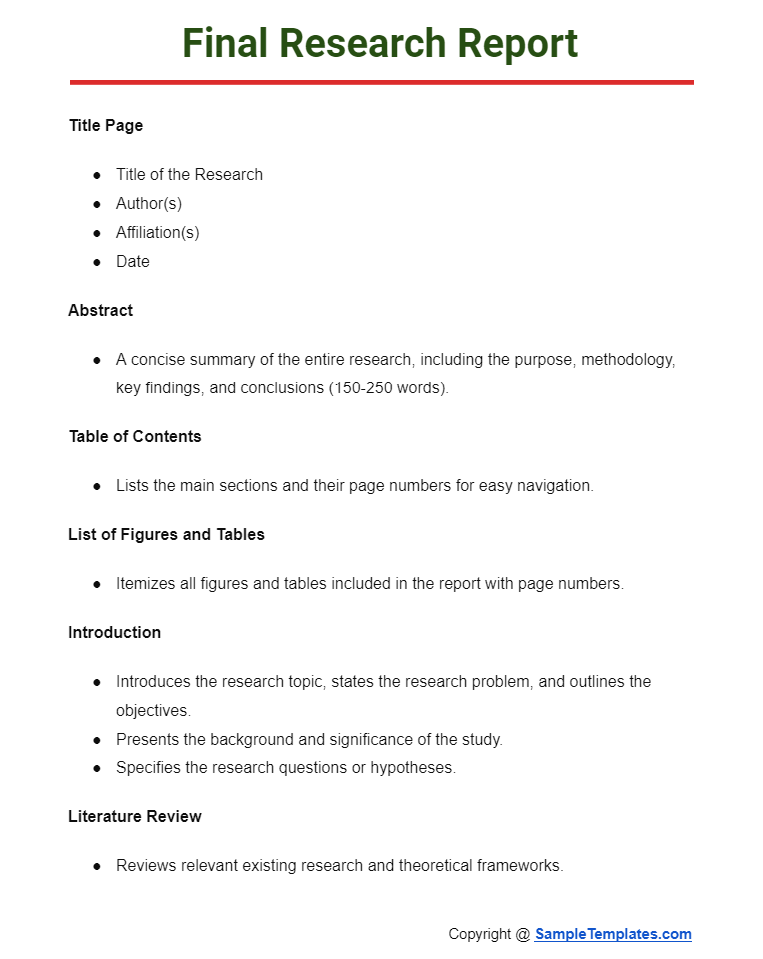
Final Research Report
Title Page
- Title of the Research
- Author(s)
- Affiliation(s)
- Date
Abstract
- A concise summary of the entire research, including the purpose, methodology, key findings, and conclusions (150-250 words).
Table of Contents
- Lists the main sections and their page numbers for easy navigation.
List of Figures and Tables
- Itemizes all figures and tables included in the report with page numbers.
Introduction
- Introduces the research topic, states the research problem, and outlines the objectives.
- Presents the background and significance of the study.
- Specifies the research questions or hypotheses.
Literature Review
- Reviews relevant existing research and theoretical frameworks.
- Establishes the foundation for the research and highlights gaps the study aims to fill.
Methodology
- Describes the research design, data collection methods, and analysis procedures.
- Details the sample selection, instruments used, and any limitations of the study.
Results (or Findings)
- Presents the data collected in an organized manner, using tables, graphs, and descriptive text.
- Summarizes the findings without interpretation.
Discussion
- Interprets the results, linking them back to the research questions and existing literature.
- Discusses the implications of the findings and any unexpected results.
- Addresses the limitations of the study and suggests areas for future research.
Conclusion
- Summarizes the key findings and their relevance.
- Restates the significance of the study and its contributions to the field.
Recommendations (if applicable)
- Provides suggestions based on the research findings for practical actions, policy changes, or further research.
References
- Lists all sources cited in the research report following the appropriate academic style (APA, MLA, Chicago, etc.).
Appendices (if necessary)
- Includes additional materials like raw data, detailed analyses, questionnaires, or maps.
Acknowledgments (optional)
- Thanks individuals, organizations, or institutions that contributed to the research.
Formatting Tips:
- Ensure consistency in headings, subheadings, and text formatting throughout the document.
- Use clear and concise language, avoiding jargon where possible.
- Proofread for spelling, grammar, and punctuation errors.
- Adhere to the citation style and formatting guidelines specified by your institution or publication.
This structure provides a comprehensive overview for writing a final research report, ensuring that all critical aspects of the research are communicated effectively.
Browse More Templates On Report
Board Report Template
Business Trip Report Template

Sales Business Trip Report Template

Quality Audit Report Template
Compliance Report Template
Board Compliance Report Template
School Report Template
Importance of Writing a Report
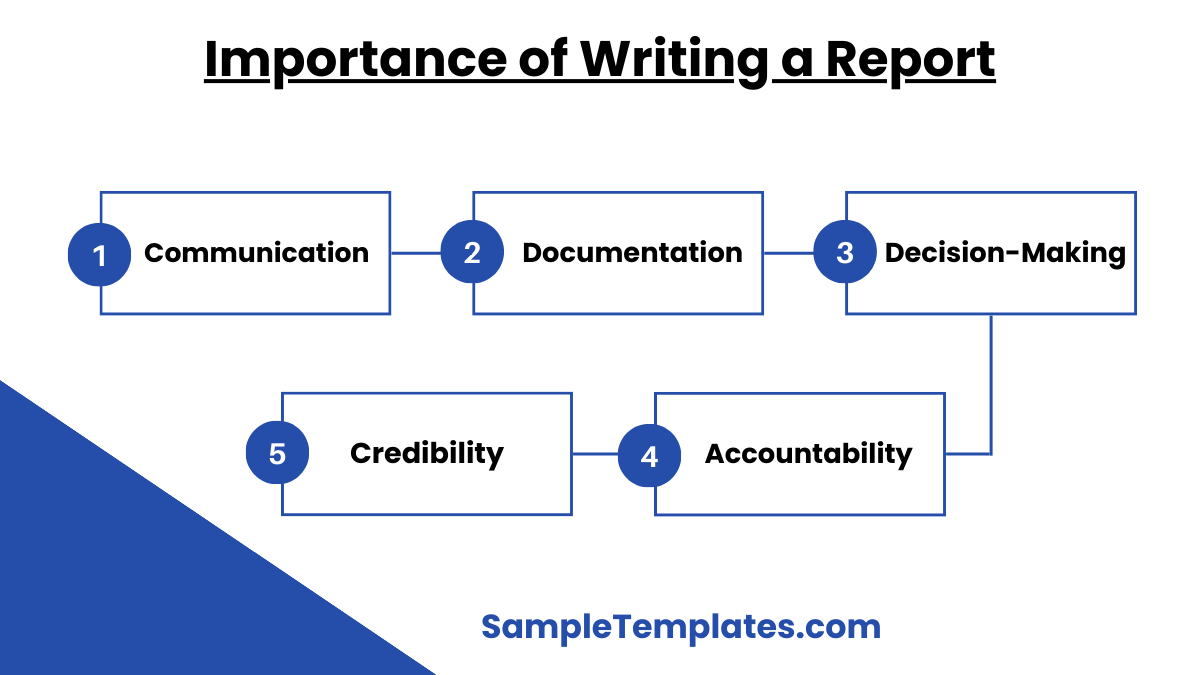
Writing a report is important for several reasons, whether in an academic, professional, or personal context. Here are some key points that highlight its importance:
- Communication: Reports effectively communicate information, findings, and recommendations to the intended audience. They help convey complex ideas in a structured and understandable manner.
- Documentation: Reports serve as official records of information, decisions, and actions taken. They provide a written record that can be referenced in the future, ensuring that important details are preserved.
- Decision-Making: Well-written reports provide essential data and insights that aid in informed decision-making. They present facts, analyses, and recommendations that help stakeholders make strategic choices.
- Accountability: Reports hold individuals and organizations accountable for their actions and performance. They provide transparency and ensure that all parties are aware of what has been done and what needs to be done.
- Analysis and Problem-Solving: Writing a report involves analyzing data, identifying problems, and proposing solutions. This process helps develop critical thinking and problem-solving skills.
- Organization and Structure: Reports require a clear and logical structure, helping to organize thoughts and information systematically. This improves clarity and ensures that the report is easy to follow.
- Professional Development: Writing reports enhances writing and research skills, which are valuable in both academic and professional settings. It helps individuals learn to present information clearly, concisely, and persuasively.
- Evaluation and Feedback: Reports often undergo review and feedback processes, which can lead to improvements and refinements. This iterative process enhances the quality of the work and contributes to learning and growth.
- Planning and Strategy: Reports are often used in planning and strategic processes. They help outline objectives, strategies, and action plans, ensuring that all stakeholders are aligned and working towards common goals.
- Credibility: A well-researched and well-written report enhances the credibility of the author and the organization. It demonstrates professionalism and a commitment to thoroughness and accuracy.
Overall, the importance of writing a report lies in its ability to effectively communicate information, support decision-making, and contribute to the development of skills and knowledge.
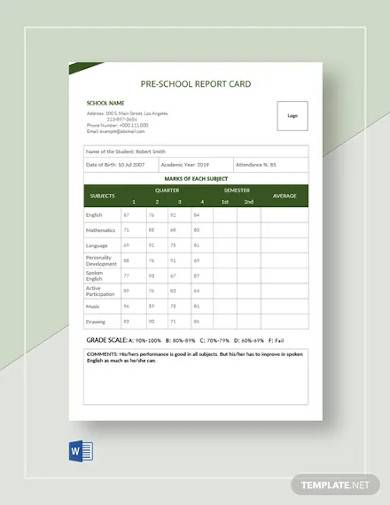
Pre School Report Card Template
Sample Project Report Format
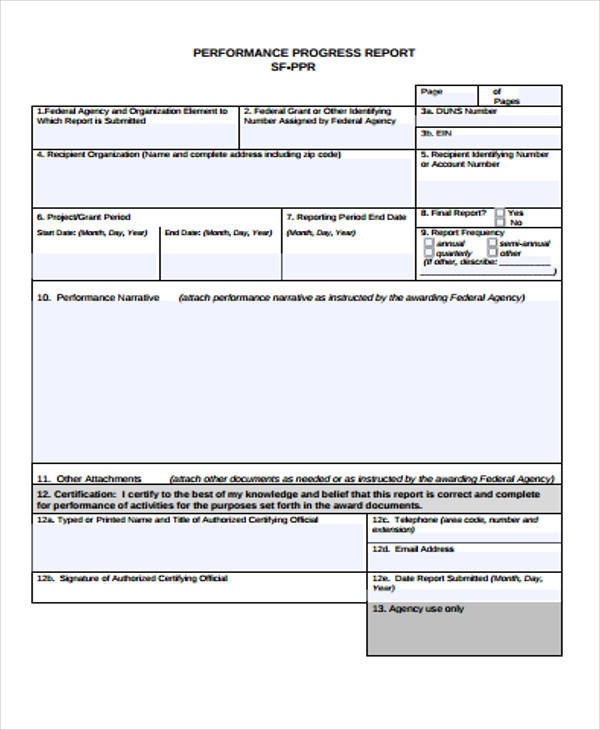
Project Progress Report Format
Sample Annual Report Format
School Annual Report Format
Annual Confidential Report Format
Sample Business Report Format
Formal Business Report Format
Business Project Report Format
Sample Narrative Report Format
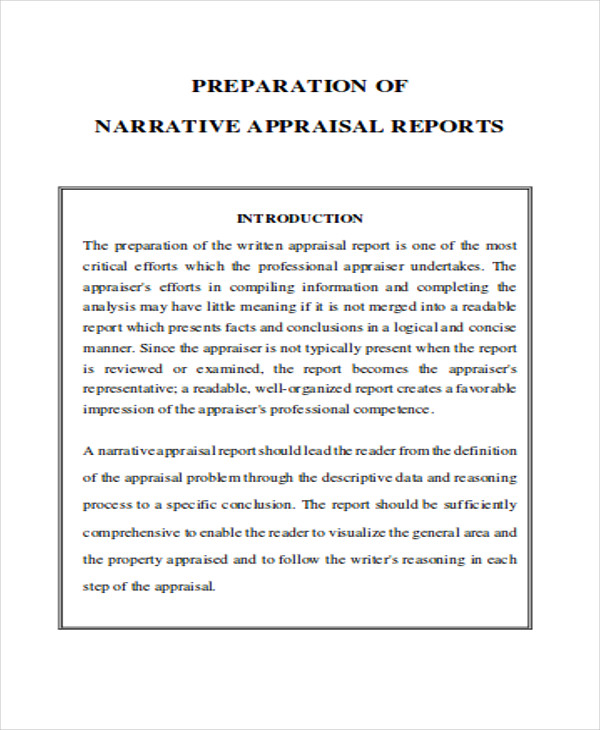
Narrative Appraisal Report Format
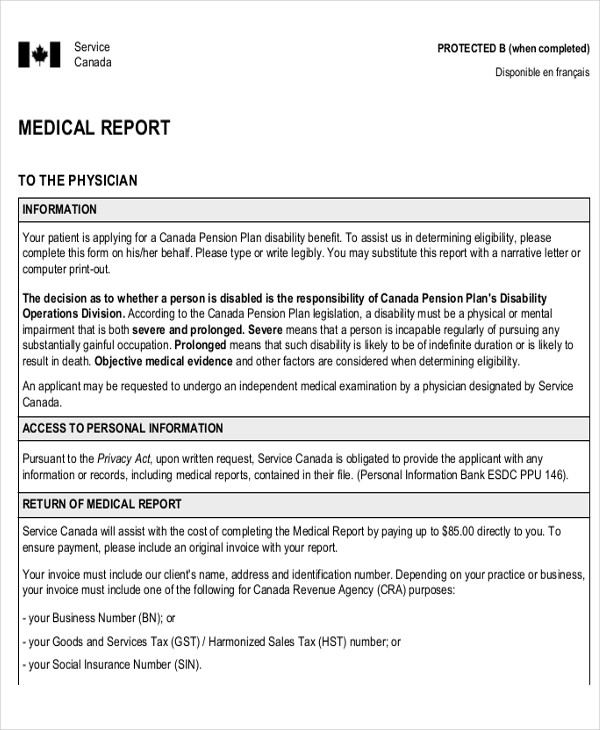
Narrative Medical Report Format
Sample Accomplishment Report Format
Annual Accomplishment Report Format
Daily Accomplishment Report Format
What Is a Report?
A report is an informational piece of work that is made to relay information to another. A report could also be used in narrating a certain event. It is done by an appointed person and relayed to a person or a group of people. A report is often written in an official document. That is why reports need to follow a certain format because they are meant to be formal records regarding certain matters.
A report needs to be backed up by accurate data. Thorough examination and investigation needs to be done to do one. A hastily done report would not be valuable and its weakness is going to show up sooner than later. It requires a lot of time and study but the final document would often be very useful for anyone doing the study.
Who Makes Reports?
Reports are done on a variety of topics and for a variety of reasons. It is initially a lot of work but the results are often very much worth the time and effort and money spent on doing one. Almost anyone with the right resources can do reports. Below are some of the people that often make these reports.
- Students – The school is one place where reports are usually done. Students are often always asked to do one. They are often asked to do a case study report or a research report. When assigned a certain task, they are also sometimes asked to do a progress report to track the development of the project.
- Auditors – After an audit, auditors are often asked to do a report on their findings. They state whether the company is complying with standards or if they are meeting the desired goals.
- Business Owners – Business owners also need to make reports on how their business is doing.
- Medical People – People in the medical field are not exempt from doing paper stuff. They are also expected to do reports on the patient’s health. Lab reports are something they also prepare.
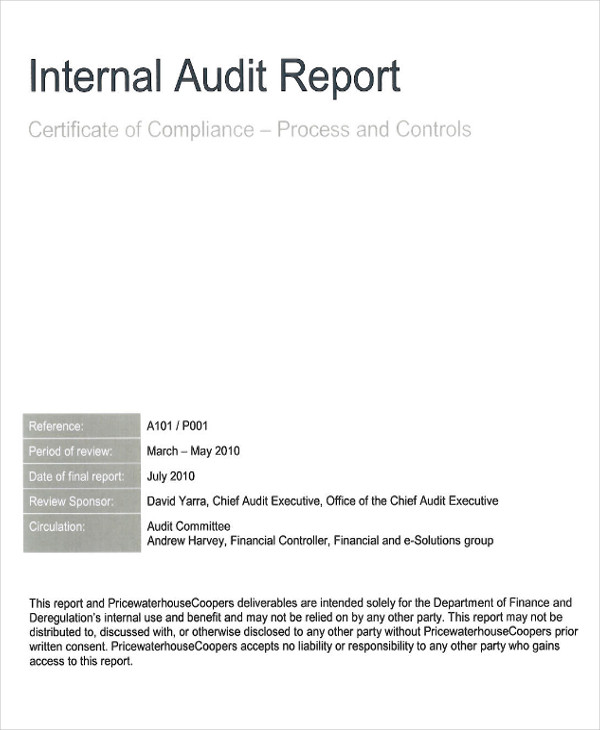
Sample Internal Audit Report Format
Bank Internal Audit Report Format
Standard Internal Audit Report Format
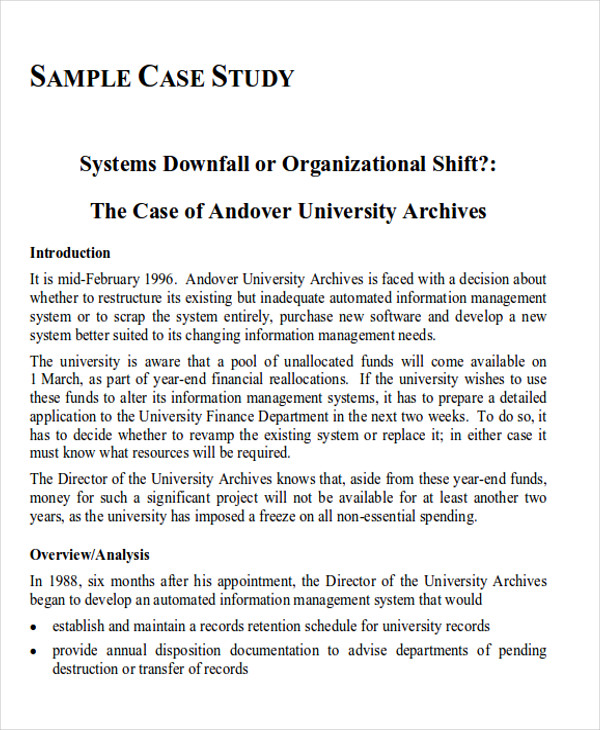
Sample Case Study Report Format
Case Study Research Report Format
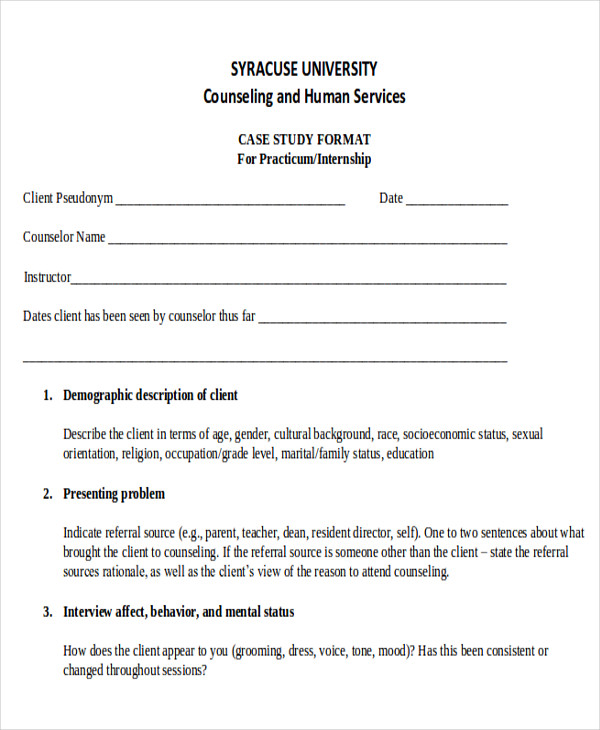
Counselling Case Study Report Format
Sample Audit Report Format
Audit Observation Report Format
Internal Audit Report Format
Sample Research Report Format
Market Research Report Format

Methods of Survey Report
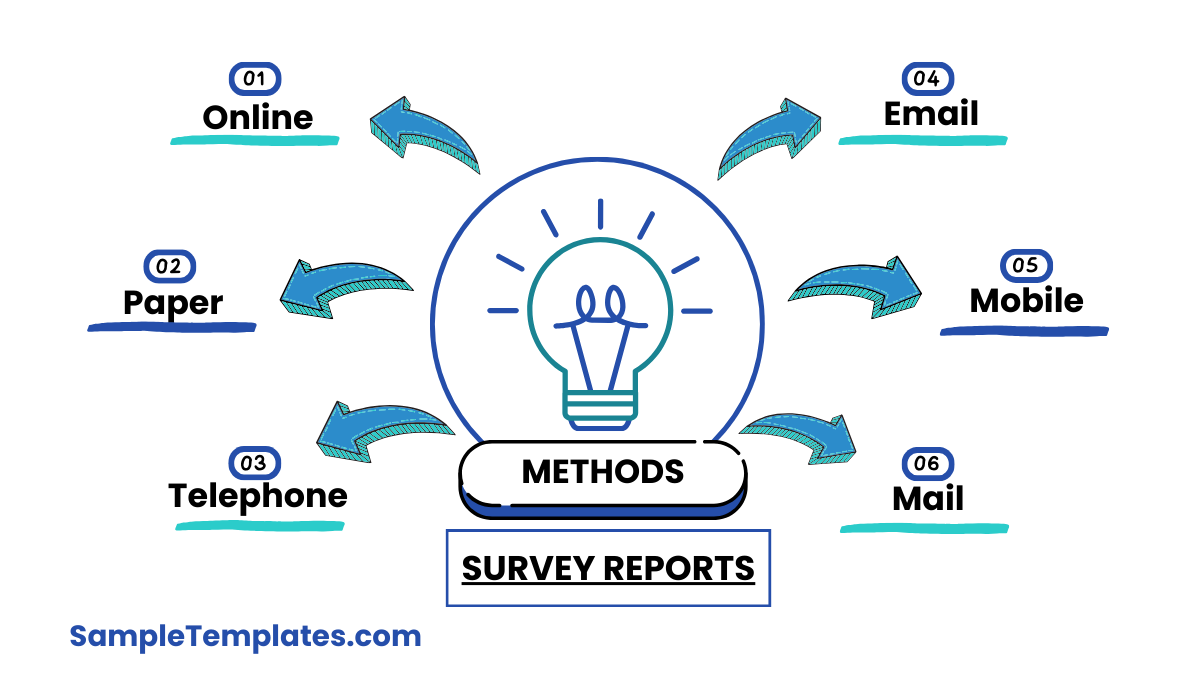
Survey reports can be generated through various methods, and the choice depends on the nature of the survey, audience, and goals. Here are common methods for creating survey reports:
- Online Surveys: Utilizing web-based platforms to collect responses, offering convenience and accessibility.
- Paper Surveys: Traditional printed surveys distributed to targeted individuals or groups.
- Telephone Surveys: Conducting interviews over the phone to gather responses directly from participants.
- In-Person Interviews: Face-to-face interactions for a more personal approach, often used in qualitative research.
- Focus Groups: Small group discussions to gather in-depth insights and opinions from participants.
- Email Surveys: Sending surveys via email to a targeted audience, allowing participants to respond at their convenience.
- Mobile Surveys: Utilizing mobile devices for survey distribution, suitable for on-the-go participants.
- Social Media Surveys: Posting surveys on social media platforms to reach a broader audience and encourage sharing.
- Mixed-Mode Surveys: Combining multiple survey methods to maximize response rates and reach diverse populations.
- Mail Surveys: Sending surveys through postal mail for participants to complete and return.
Each method has its advantages and limitations, and the choice depends on factors such as target audience, research objectives, and available resources.
Research Project Report Format

Sample Report Letter Format
Report Submission Letter Format
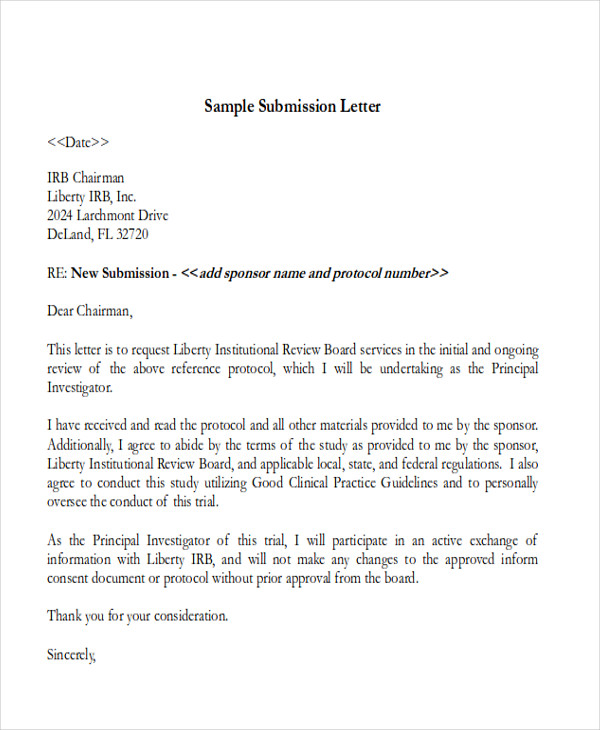
Report Cover Letter Format
The Report Format
Reports are official documents and so there is a format that needs to be followed. However, there are different types of reports according to their use and industry and so different types of report also have different elements. Because of this there is no standard format you can follow in writing a report. There are, however, some general sections that should be present in any official report. Report are not to be written like essays. It needs to be written in sections and headings and sub-headings. Listed below are the sections you would often find in a report format.
- Title – The title of the report should accurately capture the subject of the report. It should be brief but should contain a clear description of the study that you did. The title page is also the part where you often see the names of the people who did the research and the official logo of the company.
- Abstract – This is where you give a general overview of the study that was done. Make sure to state the results, conclusions, and recommendations that you came up with. However, be sure to relay all those information without going into details. That is will be discussed in the later part. Keep this one short.
- Introduction – The introduction part is where you will state the problem and how it came to be. This is important so readers will have a background of it. Also, state the purpose of doing the report in this part.
- Discussion – This part forms the body of your report. This is where you present all the data that you have gathered, the method by which you were able to obtain the data, and so on. Be sure to lay everything that you have researched in here as they will be used to back up the results that you got and the recommendations that you made.
- Summary of Results – You will need to state the results of the study that you made here. It helps if you present quantifiable results that are presented in tables and graphs as it is much easier to interpret them that way.
- Conclusion – This is where you summarize the results of your findings. Also, explain in this section the significance of your study and what it has accomplished. Only talk about what you have found out in the whole study process. Do not introduce any new information here.
- References – List in this section the full details of the sources that you used within your whole report.
Again, there is no set format for reports. There are always sections that would be needed for every other kind of report, depending on the topic and the industry it is in. A project report, for example, will have different entries on it as opposed to an internal audit report. The elements listed above, however, are the general sections that you can find in a usual report.
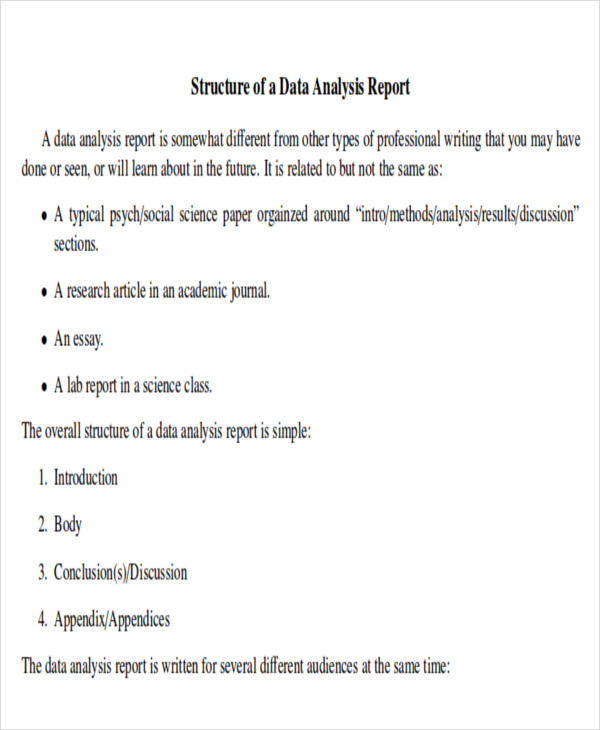
Sample Analysis Report Format
Lab Analysis Report Format
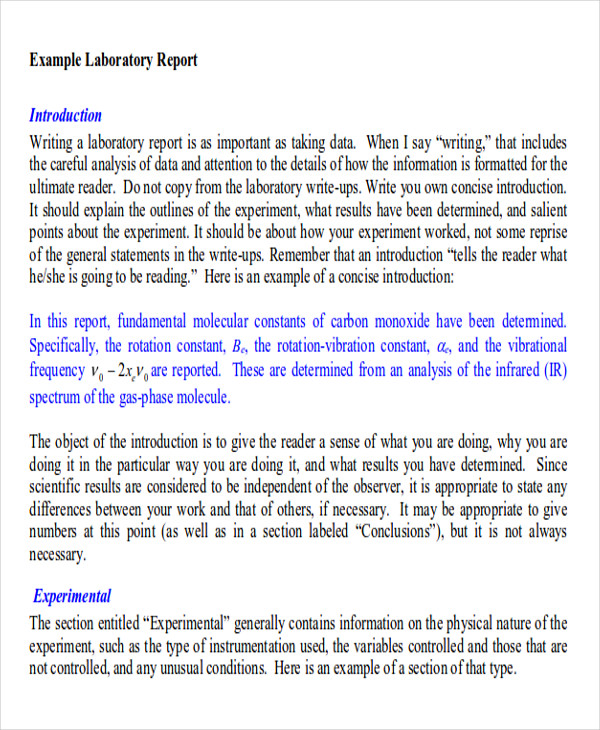
Data Analysis Report Format
Sample Case Report Format
Case Study Report Format
Medical Case Report Format
Sample Daily Report Format
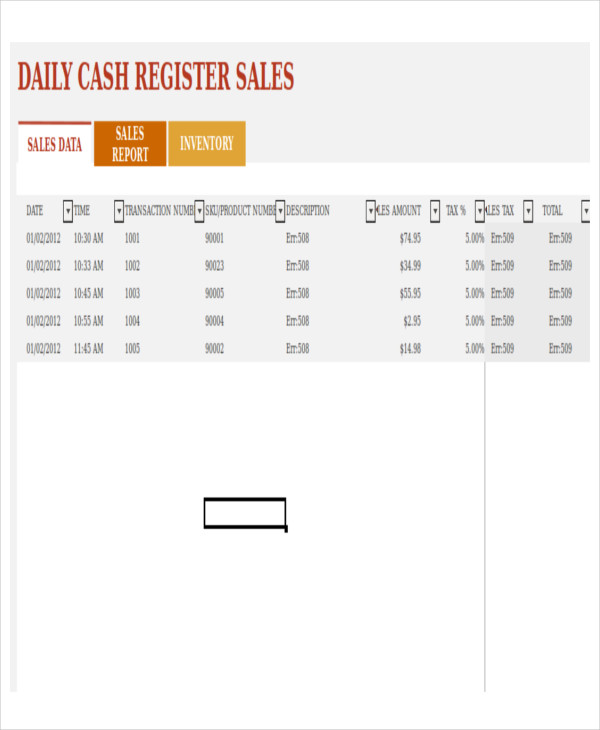
Daily Sales Report Format
Marketing Daily Report Format
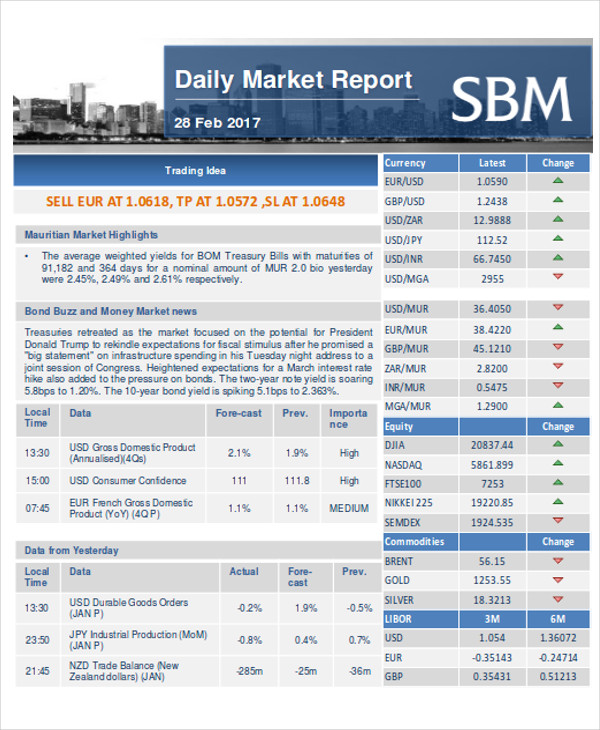
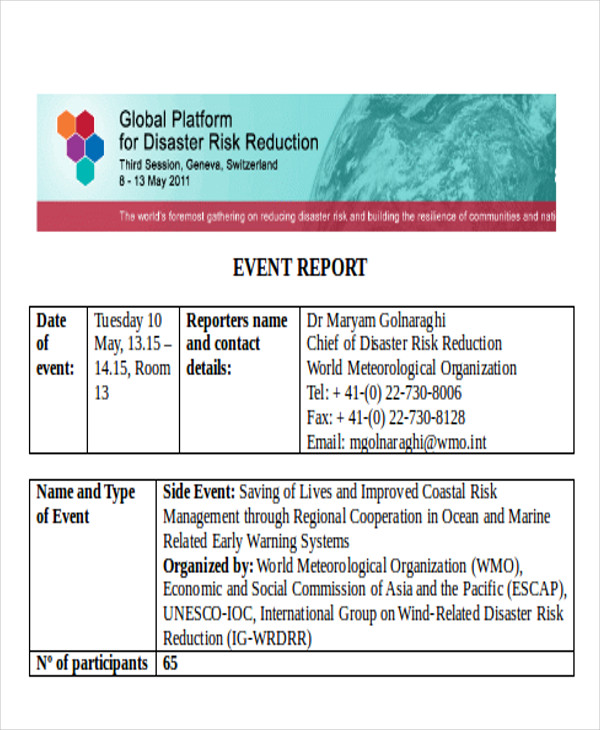
Sample Event Report Format
Post Event Report Format
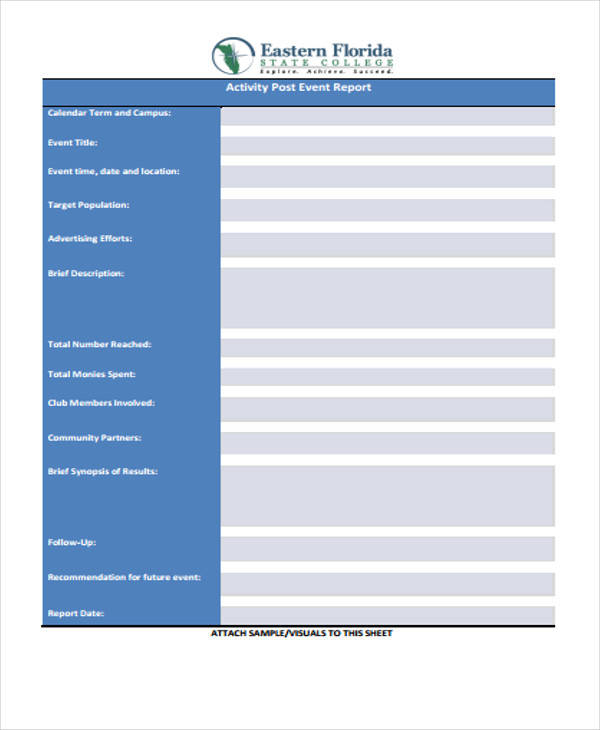
Formal Event Report Format
Sample Financial Report Format
Monthly Financial Report Format
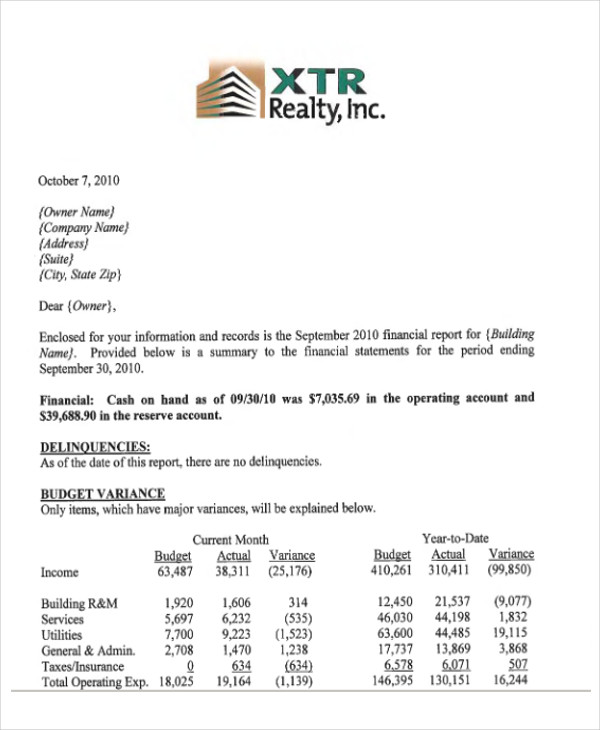
Financial Project Report Format
Examples of Reports
A report may be formal or informal. These two however can be further divided into other types of reports. There are many examples of reports that could be done. Some of them are listed below.
- Project Report – A project report talks about all the aspects when one is starting a new project. You are often introduced to a problem and see what you can do about it. The same thing is going to be done. You need to gather all the necessary data about the topic. Explain what you did, the method of obtaining information that you did, and so on. You may also do progress reports on how the project is developing.
- Annual Report – An annual report is a comprehensive report of all the things about the company from the previous year. It will often include the director’s report, an auditor’s report, a statement from the chairperson, and so on. The financial statements from the preceding year are also presented in an annual report.
- Business Report – A business report is one in which a situation is given and you are going to study it by applying business theories. The results in a business report are important pieces of information for the company because they often examine the cost that each course of action will take. A cost-benefit analysis would need to be done when doing a business report.
- Narrative Report – A narrative report is used to explain a story. That is why when writing one, it is important to maintain it in a chronological order. Make sure to properly introduce the characters, the plot, the setting, the climax, and the conclusion.
- Accomplishment Report – An accomplishment report is done to show what you have done for the company. Make sure to focus on your accomplishments and to explain your value to the company. Lay out the goals and expectation of your position and then show how you were able to accomplish those with actual numbers.
- Audit Report – This is a report done to show the findings after an audit. The auditor lists out the findings based on the things that are considered to be important in the success of the company.
- Case Study Report – You are given a case and you need to make a report on how you will approach the case problem. In this type of report, you need to carefully analyze the situation and put your results and recommendations into writing.
- Research Report – Almost anything can be studied using research. A topic is given to the researcher and he or she will approach the problem by researching. The research problem together with results and findings are placed in a document called a research report.
- Daily Report – This report is all about the tasks accomplished by employees on a certain day. These are of course updated every day to keep track of the performance and progress of employees.
- Financial Report – This is a detailed report of the financial information of people or a business entity.
Sample HR Report Format
Monthly HR Report Format

HR Audit Report Format
Sample Lab Report Format
Lab Test Report Format
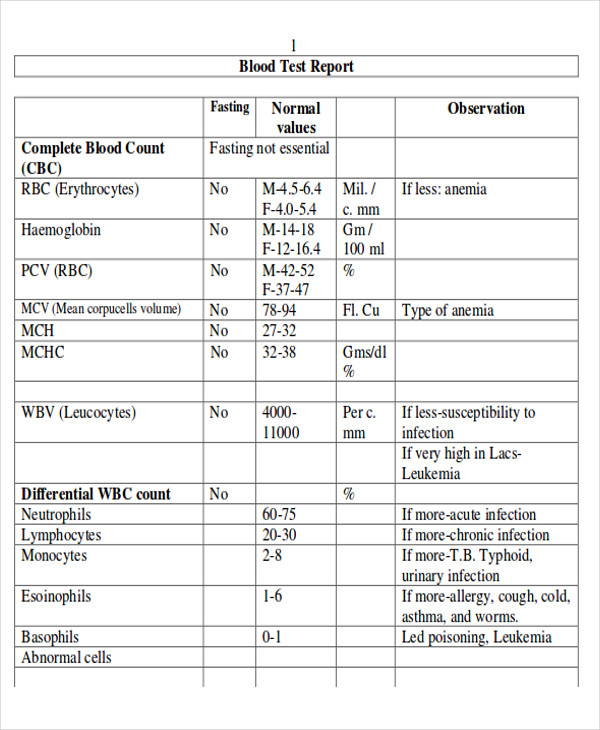
Chemistry Lab Report Format

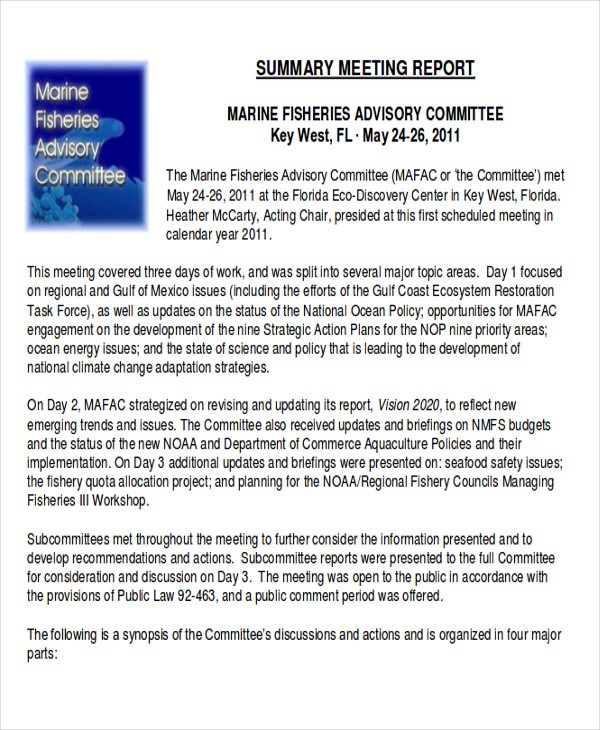
Sample Meeting Report Format
Meeting Minutes Report Format

Meeting Summary Report Format
Sample Research Report Format
Business Research Report Format
Research Project Report Format
Sample Sales Report Format
Sales Report Analysis Format

Sales Visit Report Format
Tips in Making a Report
There are many instances when one would be asked to make a report. It could be for school, assigned as a homework, or it could be for work. There are also different kinds of reports that one will be asked to do depending on the requirements of your supervisor. That is why there are also components that could be found on one report and another component that is totally unique to another report.
Writing a report is not an easy thing to do. There are so many things to consider and it could get too overwhelming to just even start writing. Add to that the immense amount of research that you have to do in order to write the content of your report. We understand that making a report is not an easy task and so we have compiled some useful tips that you can apply when you are making your next report.
- Know the report’s purpose. Before writing the report, make sure to determine it’s real purpose. What do you want to accomplish by making this report? Do you want to inform your readers? Do you want to persuade them about your idea? Knowing the report’s purpose gives you a clear direction as to where you want to go with it, which makes it easier to write.
- Maintain a logical flow. This is common sense but you will be surprised at the number of people who forget about this rule. The report should start with a good introduction, then you go to the body, and then make a conclusion. Make sure that the points you stated in the previous section would lead on easily into the second point.
- Use visuals to reinforce your content. Visuals are very effective ways of grabbing your reader’s attention and augmenting your content. When done right, the images and illustrations you add to your report could prove to be very beneficial to you.
- Review. Review your report and revise when needed. Also, let someone else review your report. You may be blind to your own mistakes and so a different set of eyes would catch mistakes that you won’t.
When making, say, an annual report, there will have to be steps to be followed and a format that needs to be observed. It is a formal document and so these things need to be complied with. Our report samples contain these formats and have all the necessary elements that make a good report.
How to begin a report?
Start with a clear title and an executive summary. Introduce the purpose, scope, and objectives of the report. Provide background information and context, outlining the main points to be covered.
What not to write in a report?
Avoid personal opinions, biased language, irrelevant details, and unverified information. Don’t use informal language, slang, or excessive jargon. Steer clear of overly complex sentences and unsupported claims.
What must a report include?
A report should include a title page, executive summary, introduction, methodology, findings, analysis, conclusions, recommendations, and references. Ensure clear headings, structured content, and relevant data.
How do I end a report?
Conclude with a summary of key findings and their implications. Provide actionable recommendations and highlight the next steps. End with a concise conclusion that reinforces the main points and objectives.
In conclusion, this report highlights key findings and their implications, providing actionable recommendations. The analysis supports the objectives and demonstrates the necessity of the proposed steps. Implementing these suggestions will enhance performance and address identified issues, ensuring future success and growth.
Related Posts
Sample Science Project Reports
Business Report Samples & Templates
Survey Reports Samples & Templates
Sample Feasibility Reports
Psychological Assessment Report Samples [ Clinical, Child, Intake ]
Acknowledgement for Internship Report Samples [ Hotel, Hospital, Teaching ]
Field Trip Report Samples [ Agriculture, Educational, Environmental ]
Student Counseling Report Samples
Narrative Accomplishment Report Samples [ Science, Teacher, Reading ]
Sample Acknowledgment Report Templates
Internship Narrative Report Samples
Interview Summary Report Samples
Sample Medical Reports
Accomplishment Report Samples
Acknowledgement for Project Report Samples [ MBA, Engineering, Internship ]