
Data analysis has now become a big integral part of every industry. Data analysts have the highest paid salary in the world. Data analysis requires a lot of aids for different software but most importantly the data must be organized and presented correctly for better analysis essay, prediction, and understanding.
The following Data Analysis Samples Excel templates have the sound formats and templates to record the relevant data and they are presented in the form of pretty graphs.
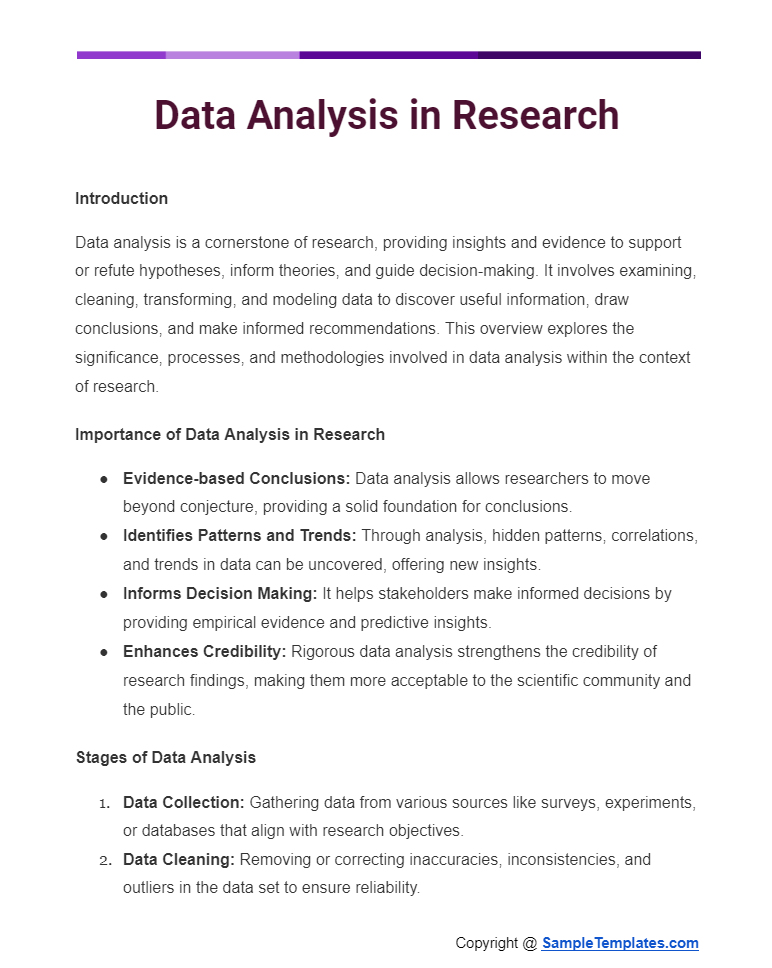
Data Analysis in Research
Introduction
Data analysis is a cornerstone of research, providing insights and evidence to support or refute hypotheses, inform theories, and guide decision-making. It involves examining, cleaning, transforming, and modeling data to discover useful information, draw conclusions, and make informed recommendations. This overview explores the significance, processes, and methodologies involved in data analysis within the context of research.
Importance of Data Analysis in Research
- Evidence-based Conclusions: Data analysis allows researchers to move beyond conjecture, providing a solid foundation for conclusions.
- Identifies Patterns and Trends: Through analysis, hidden patterns, correlations, and trends in data can be uncovered, offering new insights.
- Informs Decision Making: It helps stakeholders make informed decisions by providing empirical evidence and predictive insights.
- Enhances Credibility: Rigorous data analysis strengthens the credibility of research findings, making them more acceptable to the scientific community and the public.
Stages of Data Analysis
- Data Collection: Gathering data from various sources like surveys, experiments, or databases that align with research objectives.
- Data Cleaning: Removing or correcting inaccuracies, inconsistencies, and outliers in the data set to ensure reliability.
- Data Exploration: Conducting preliminary analyses, often using descriptive statistics to get a sense of the data’s structure and content.
- Data Transformation: Modifying data if necessary to facilitate analysis, which may include normalizing data scales or handling missing values.
- Data Modeling: Applying statistical or computational models to understand relationships between variables or to predict outcomes.
- Interpretation of Results: Analyzing the outcomes of data modeling to draw meaningful conclusions and implications.
- Presentation of Findings: Communicating the results of the analysis in an accessible format, often accompanied by visual data representations like charts and graphs.
Methodologies in Data Analysis
- Quantitative Analysis: Utilizes statistical methods to quantify relationships between variables, often used in experimental and observational studies.
- Qualitative Analysis: Focuses on non-numerical data, seeking to understand concepts, themes, and patterns in data, common in social sciences.
- Mixed-Methods Analysis: Combines both quantitative and qualitative approaches to provide a more comprehensive understanding of the research question.
Tools and Software in Data Analysis
Technological advancements have led to the development of sophisticated tools and software designed to streamline the data analysis process. These include:
- Statistical Software: Such as SPSS, SAS, and R, which are used for complex statistical testing and modeling.
- Data Visualization Tools: Like Tableau and Power BI, which help in creating interactive charts and graphs for easier data interpretation.
- Programming Languages: Python and R are particularly popular for data analysis due to their powerful libraries and flexibility.
Challenges in Data Analysis
- Data Quality: Poor quality data can lead to inaccurate conclusions.
- Complexity of Data: Large datasets or complex variables can complicate analysis.
- Bias: Researcher bias in data interpretation can skew results.
- Software and Skills: The need for specialized software and analytical skills can be a barrier for some researchers.
Conclusion
Data analysis is an integral part of the research process, enabling researchers to derive meaningful insights from data. By carefully navigating the stages of data analysis and employing appropriate methodologies, researchers can ensure their findings are robust, credible, and valuable. As data continues to grow in volume and complexity, the role of data analysis in research will only become more critical, underscoring the need for continuous learning and adaptation in analytical techniques and tools.
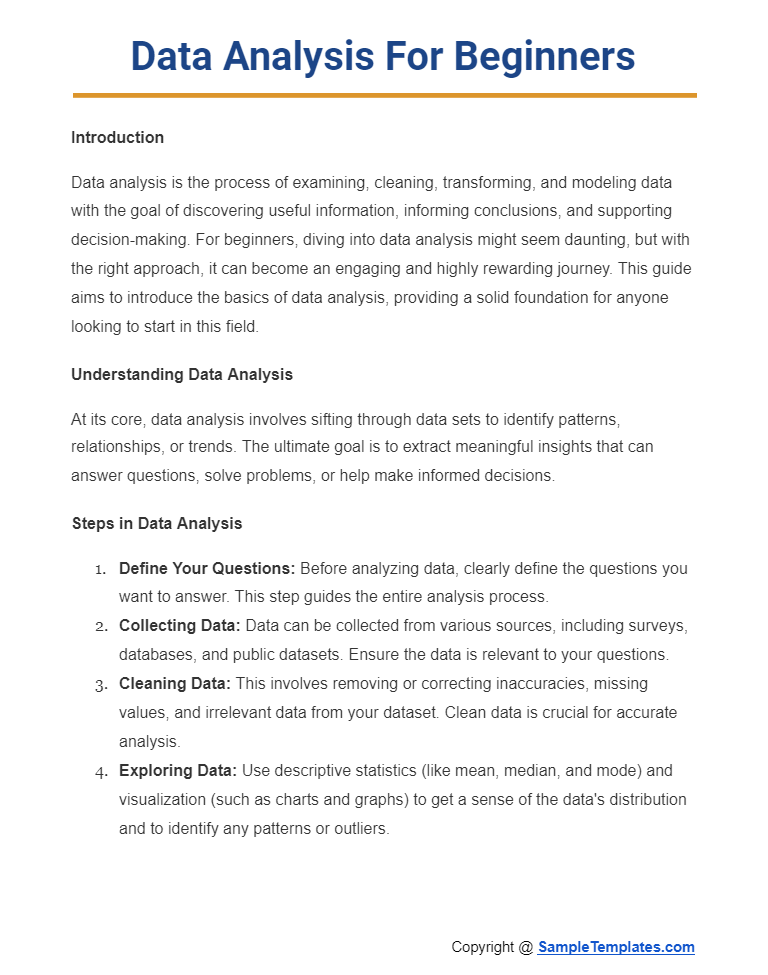
Data Analysis for Beginners
Introduction
Data analysis is the process of examining, cleaning, transforming, and modeling data with the goal of discovering useful information, informing conclusions, and supporting decision-making. For beginners, diving into data analysis might seem daunting, but with the right approach, it can become an engaging and highly rewarding journey. This guide aims to introduce the basics of data analysis, providing a solid foundation for anyone looking to start in this field.
Understanding Data Analysis
At its core, data analysis involves sifting through data sets to identify patterns, relationships, or trends. The ultimate goal is to extract meaningful insights that can answer questions, solve problems, or help make informed decisions.
Steps in Data Analysis
- Define Your Questions: Before analyzing data, clearly define the questions you want to answer. This step guides the entire analysis process.
- Collecting Data: Data can be collected from various sources, including surveys, databases, and public datasets. Ensure the data is relevant to your questions.
- Cleaning Data: This involves removing or correcting inaccuracies, missing values, and irrelevant data from your dataset. Clean data is crucial for accurate analysis.
- Exploring Data: Use descriptive statistics (like mean, median, and mode) and visualization (such as charts and graphs) to get a sense of the data’s distribution and to identify any patterns or outliers.
- Analyzing Data: Depending on your question, this might involve more complex statistical methods to test hypotheses or build models. For beginners, focusing on understanding basic relationships between variables can be a good start.
- Interpreting Results: Analyze the outcomes to draw conclusions. Look for answers to your initial questions and consider the implications of your findings.
- Communicating Findings: Share your results through reports, presentations, or visualizations. Communicating your findings effectively is as important as the analysis itself.
Tools and Resources
Several tools can help beginners start with data analysis:
- Excel: A great starting point for beginners, offering a range of functionalities for basic data analysis and visualization.
- Google Sheets: Similar to Excel, with the added benefit of easy sharing and collaboration online.
- R and Python: Programming languages that offer more flexibility and power for data analysis. They have a steeper learning curve but are invaluable in the long run.
- Tableau: A tool for creating interactive data visualizations, with a user-friendly interface suitable for beginners.
Best Practices for Beginners
- Start Small: Begin with small datasets and simple questions to build your confidence.
- Practice Regularly: The more you practice, the more comfortable you’ll become with different types of data and analysis techniques.
- Learn from Mistakes: Mistakes are valuable learning opportunities. Analyze what went wrong and how you can improve.
- Seek Feedback: Share your findings with others and be open to feedback. Different perspectives can enhance your analysis.
Conclusion
Data analysis is a powerful skill that can uncover hidden insights and inform decision-making across various fields. For beginners, the key is to start simple, be patient, and gradually build up your skills and knowledge. Remember, every expert was once a beginner. With curiosity and perseverance, you can develop a strong foundation in data analysis and embark on a rewarding journey of discovery.
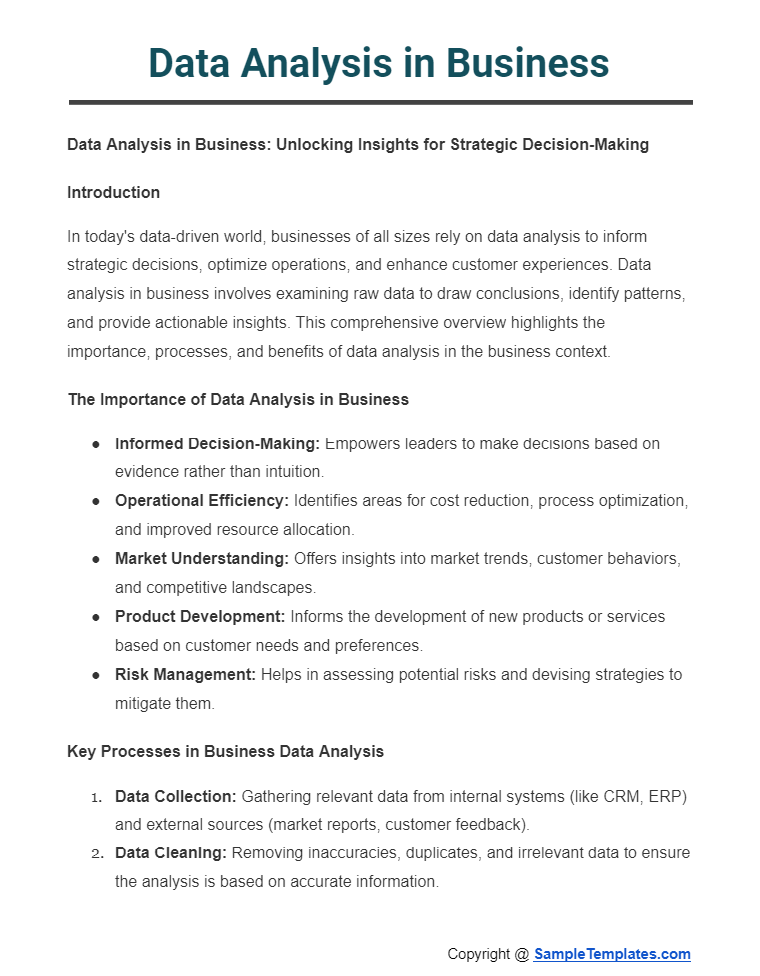
Data Analysis in Business
Data Analysis in Business: Unlocking Insights for Strategic Decision-Making
Introduction
In today’s data-driven world, businesses of all sizes rely on data analysis to inform strategic decisions, optimize operations, and enhance customer experiences. Data analysis in business involves examining raw data to draw conclusions, identify patterns, and provide actionable insights. This comprehensive overview highlights the importance, processes, and benefits of data analysis in the business context.
The Importance of Data Analysis in Business
- Informed Decision-Making: Empowers leaders to make decisions based on evidence rather than intuition.
- Operational Efficiency: Identifies areas for cost reduction, process optimization, and improved resource allocation.
- Market Understanding: Offers insights into market trends, customer behaviors, and competitive landscapes.
- Product Development: Informs the development of new products or services based on customer needs and preferences.
- Risk Management: Helps in assessing potential risks and devising strategies to mitigate them.
Key Processes in Business Data Analysis
- Data Collection: Gathering relevant data from internal systems (like CRM, ERP) and external sources (market reports, customer feedback).
- Data Cleaning: Removing inaccuracies, duplicates, and irrelevant data to ensure the analysis is based on accurate information.
- Data Exploration: Conducting preliminary investigations to understand the data’s structure, content, and potential insights.
- Data Modeling: Using statistical models to identify relationships between variables or to predict trends and outcomes.
- Data Visualization: Presenting findings through charts, graphs, and dashboards for easier interpretation and decision-making.
- Insight Generation: Translating data findings into actionable business insights that can guide strategy and operations.
Tools and Technologies
Several tools and technologies facilitate data analysis in business:
- Excel: A versatile tool for basic data analysis and visualization, suitable for small datasets.
- SQL: Essential for querying databases to extract and analyze large volumes of data.
- Business Intelligence (BI) Tools: Such as Tableau, Power BI, and QlikView, which offer advanced data visualization and analytics capabilities.
- Statistical Software: Including R and Python, which provide powerful libraries for advanced statistical analysis and predictive modeling.
Benefits of Data Analysis for Businesses
- Enhanced Customer Insights: Understand customer needs, preferences, and behaviors to tailor products and marketing strategies.
- Competitive Advantage: Leveraging unique insights can differentiate a business from competitors.
- Revenue Growth: Identifying new market opportunities, optimizing pricing strategies, and improving sales tactics.
- Operational Excellence: Streamlining operations, improving supply chain management, and enhancing overall efficiency.
Challenges and Best Practices
- Data Quality: Ensure the reliability and accuracy of data sources to base analysis on solid foundations.
- Skill Set: Building a team with the right mix of analytical skills and business acumen is crucial.
- Privacy and Security: Adhering to data protection regulations and ethical considerations to safeguard customer information.
- Continuous Learning: Staying updated with the latest tools, techniques, and trends in data analysis and business intelligence.
Conclusion
Data analysis stands as a critical component of modern business strategy, driving growth, efficiency, and innovation. By leveraging data effectively, businesses can unlock a wealth of insights, foster a competitive edge, and navigate the complexities of today’s market landscapes with confidence. Embracing a culture of data-driven decision-making is not just beneficial but essential for success in the digital age.
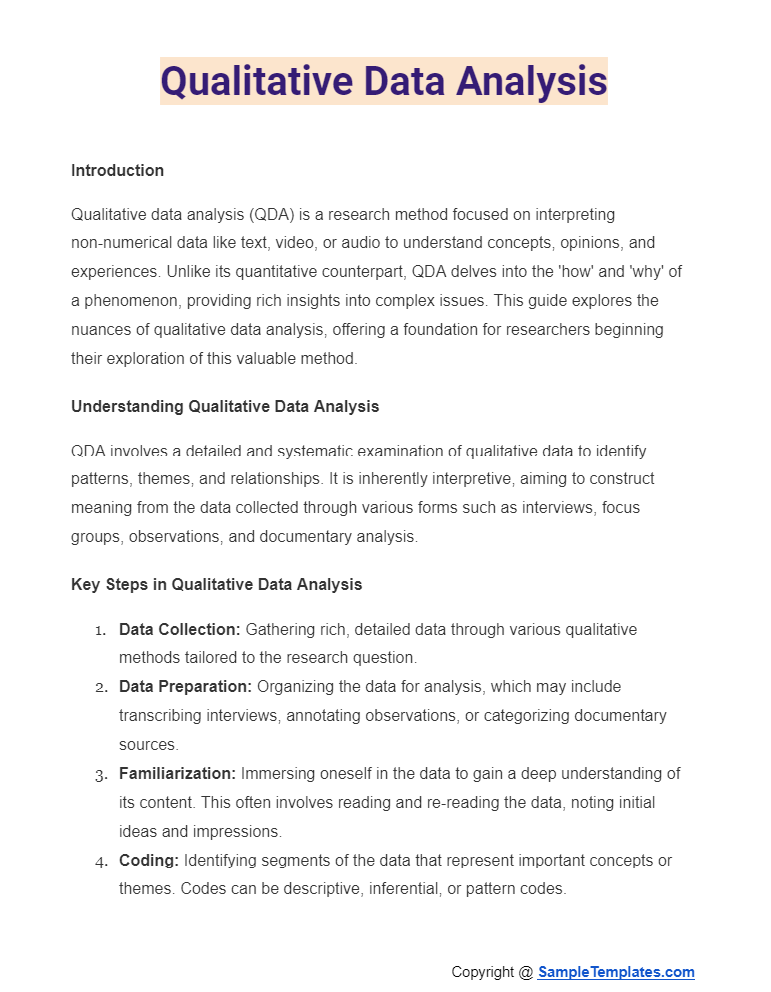
Qualitative Data Analysis
Introduction
Qualitative data analysis (QDA) is a research method focused on interpreting non-numerical data like text, video, or audio to understand concepts, opinions, and experiences. Unlike its quantitative counterpart, QDA delves into the ‘how’ and ‘why’ of a phenomenon, providing rich insights into complex issues. This guide explores the nuances of qualitative data analysis, offering a foundation for researchers beginning their exploration of this valuable method.
Understanding Qualitative Data Analysis
QDA involves a detailed and systematic examination of qualitative data to identify patterns, themes, and relationships. It is inherently interpretive, aiming to construct meaning from the data collected through various forms such as interviews, focus groups, observations, and documentary analysis.
Key Steps in Qualitative Data Analysis
- Data Collection: Gathering rich, detailed data through various qualitative methods tailored to the research question.
- Data Preparation: Organizing the data for analysis, which may include transcribing interviews, annotating observations, or categorizing documentary sources.
- Familiarization: Immersing oneself in the data to gain a deep understanding of its content. This often involves reading and re-reading the data, noting initial ideas and impressions.
- Coding: Identifying segments of the data that represent important concepts or themes. Codes can be descriptive, inferential, or pattern codes.
- Theme Development: Combining codes into broader themes that capture the essence of the data. Themes should reflect the key concepts that emerge from the data and relate directly to the research questions.
- Interpretation: Understanding and explaining the meaning of the codes and themes in relation to the research questions, literature, and theoretical frameworks.
- Reporting: Presenting the findings in a structured format, often using quotations from the data to illustrate and support the analysis.
Techniques and Tools for Qualitative Data Analysis
- Manual Coding: Though time-consuming, manual coding allows for deep engagement with the data.
- Software Tools: Programs like NVivo, ATLAS.ti, and MAXQDA help manage, code, and analyze large volumes of qualitative data more efficiently.
- Thematic Analysis: A widely used method for identifying, analyzing, and reporting patterns (themes) within data.
- Content Analysis: Focuses on the context and frequency of specific words or concepts within the data.
- Narrative Analysis: Examines the stories or accounts given by participants, focusing on how they construct and understand their experiences.
Challenges and Solutions in Qualitative Data Analysis
- Subjectivity: The researcher’s biases can influence the analysis. Reflexivity, or reflecting on one’s biases, and peer debriefing can mitigate this issue.
- Data Overload: Qualitative data can be overwhelming. Using software for data management and maintaining organized, systematic codes can help.
- Ensuring Reliability and Validity: Employ techniques such as triangulation (using multiple data sources or methods), member checking (validating findings with participants), and providing rich, thick descriptions to ensure the research’s credibility.
Conclusion
Qualitative data analysis offers a nuanced and in-depth understanding of complex phenomena, capturing the richness and complexity of human experiences. By systematically organizing, coding, and interpreting qualitative data, researchers can uncover valuable insights that quantitative methods alone may not reveal. As with any research method, the key to effective QDA lies in rigorous methodology, reflexivity, and a clear alignment with the research questions and objectives.
Browse More Templates On Data Analysis
Business Data Analysis Report Template
Sample Data Analysis Report Template
Formal School Data Analysis Template
Data Analysis Project Plan Template
Sample Data Analysis Research Plan Template
Qualitative Data Analysis Plan Template
Survey Data Analysis Plan Template
Data Management and Analysis Plan Template
Sample Data Analysis Action Plan Template
Data Analysis Strategic Plan Template
Data Analysis Plan Template
Free Data Collection And Analysis Plan Template
Sample Data Analysis Report Template

Importance of Data Analysis
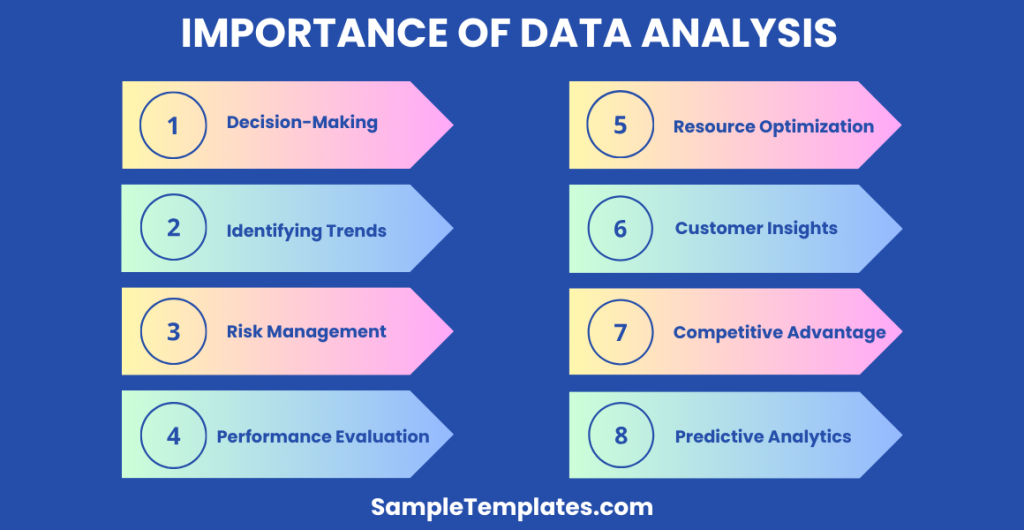
- Informed Decision-Making: Data analysis enables organizations to make informed decisions based on evidence and insights derived from data, leading to more effective strategies and outcomes.
- Identifying Trends: By analyzing data, organizations can identify trends and patterns, helping them anticipate market changes, customer preferences, and emerging opportunities.
- Risk Management: Data analysis allows organizations to assess risks by analyzing historical data, identifying potential threats, and implementing mitigation strategies to minimize negative impacts.
- Performance Evaluation: Data analysis helps evaluate the performance of various aspects of an organization, such as sales, marketing campaigns, and operational efficiency, enabling continuous improvement.
- Resource Optimization: Through data analysis, organizations can identify inefficiencies and optimize resource allocation, maximizing productivity and minimizing costs.
- Customer Insights: Analyzing customer data provides valuable insights into customer behavior, preferences, and satisfaction levels, enabling organizations to tailor products and services to meet their needs effectively.
- Competitive Advantage: Data analysis helps organizations gain a competitive edge by identifying market trends, understanding customer needs better, and responding quickly to changes in the competitive landscape.
- Predictive Analytics: By leveraging advanced analytics techniques, organizations can forecast future trends, anticipate customer behavior, and make proactive decisions to stay ahead of the curve.
Basic Data Envelopment Analysis Excel
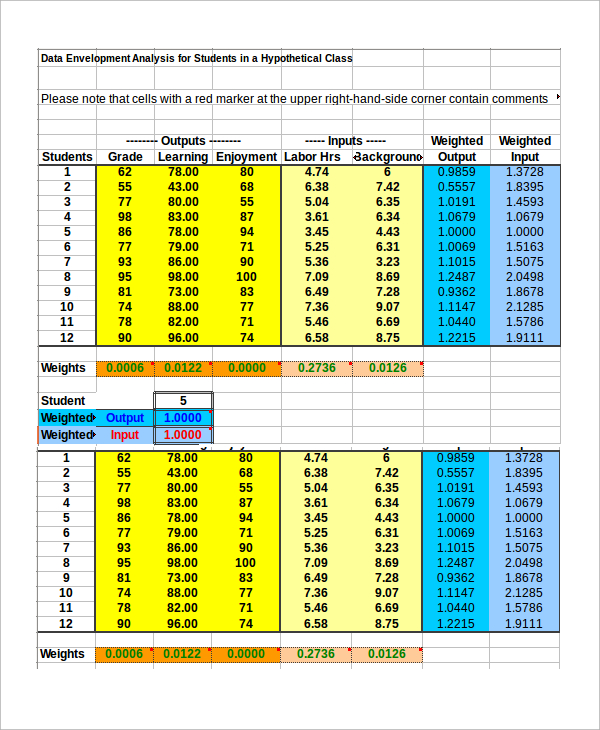
This is an Excel sheet sample for environmental data analysis. It has provisions to record the critical data and parameters of the environment that are collected through different instruments and map them in the template to find out future prediction and critical outcomes.
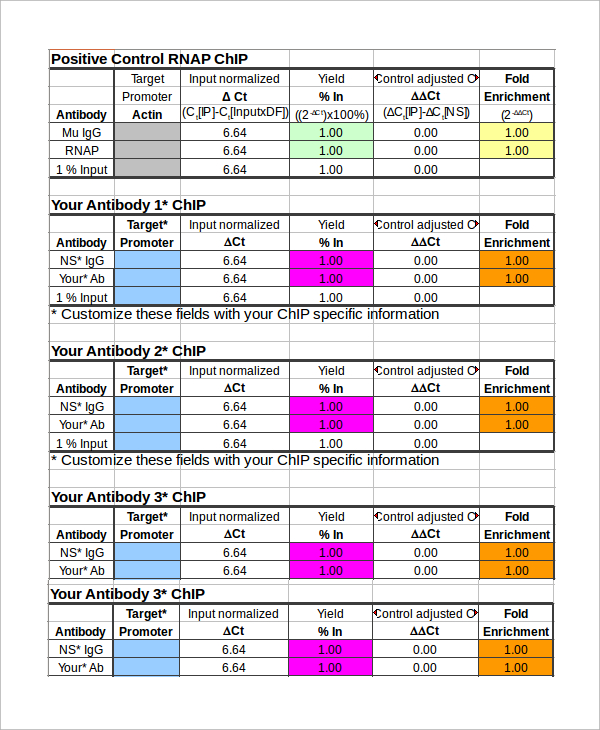
Sample Quantification Data Analysis Excel
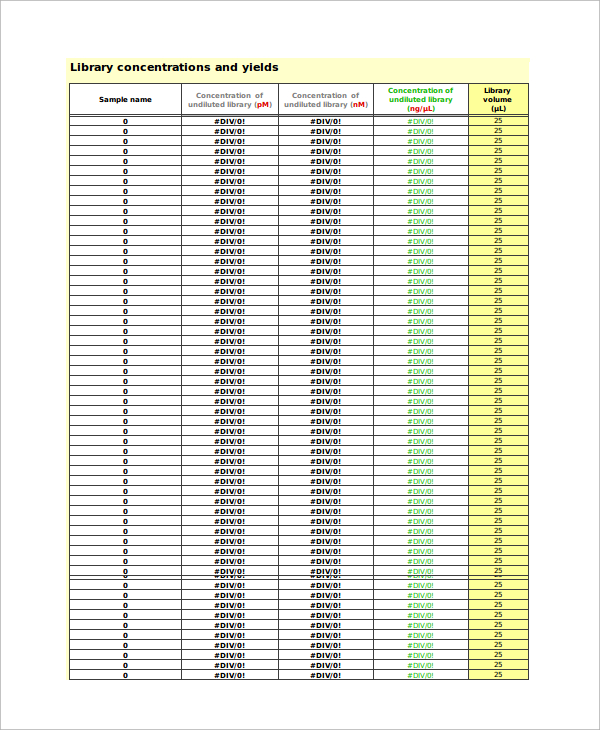
Quantification data analysis is critical in medical researches. The provided Excel template has the perfect format to record all the information and data and analysis for research statement purposes and making discoveries through them.
How To Get Started With Data Analysis
- Define Your Objectives: Clearly define the objectives of your data analysis. Determine what questions you want to answer or what insights you hope to gain from the data.
- Gather Relevant Data: Collect the data sources necessary for your analysis. Ensure the data is accurate, complete, and relevant to your objectives.
- Preprocess the Data: Clean and preprocess the data to remove errors, inconsistencies, and missing values. This may involve tasks such as data cleaning, data transformation, and data normalization.
- Choose Analysis Techniques: Select the appropriate data analysis techniques based on your objectives and the nature of your data. This may include descriptive statistics, data visualization, hypothesis testing, regression analysis, or machine learning algorithms.
- Perform the Analysis: Apply the chosen analysis techniques to the preprocessed data. Use statistical software or programming languages like Python or R to conduct the analysis efficiently.
- Interpret the Results: Analyze the results of your analysis to draw meaningful conclusions. Identify trends, patterns, correlations, or insights that address your objectives and provide valuable information.
- Communicate Findings: Present your findings in a clear and concise manner. Use data visualization tools, charts, graphs, and written reports to communicate the results effectively to stakeholders.
- Iterate and Refine: Review your analysis process and results, and iterate as needed to refine your approach. Continuously improve your data analysis skills and techniques based on sample feedback and new insights gained from the data.
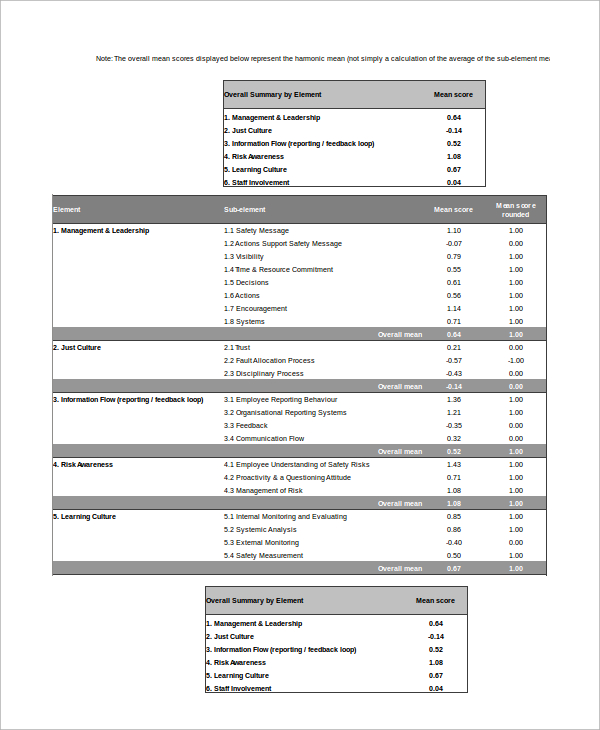
Water Balance Data Analysis Excel Template
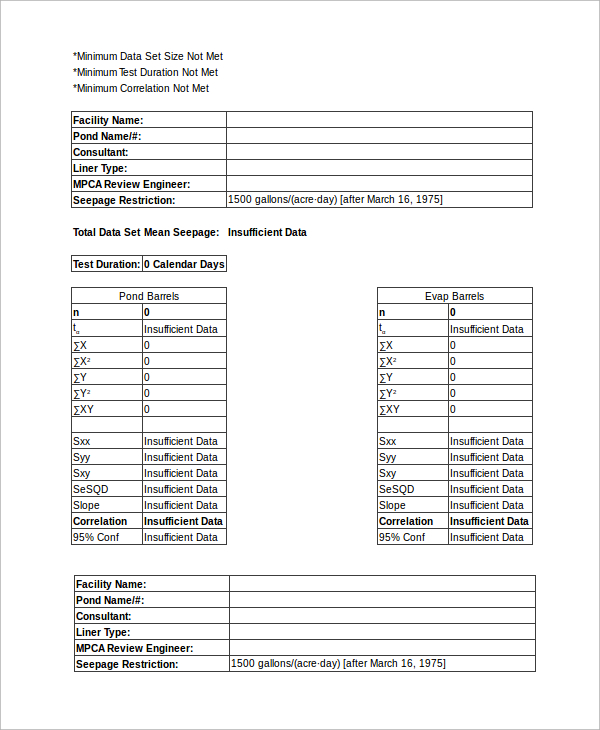
This is a perfect format for water balance data analysis in Microsoft Excel. It contains three sheets of data collection, different sheets for output summary, adjusted data graph and mean seepage graph for clear illustration and complete data analysis.
Usage of Data Analysis
Data analysis shows a company the future risk, the points of weaknesses and strengths, the areas of opportunities. It also predicts the future trend in the business, the areas to beat the peers and score over them.
The above-listed data analysis templates in excel are perfect for companies to record the relevant data and provide them to the data analyst who can analyze them and provide relevant graphs to keep the higher authorities understand the trend and other stuff that the data and graphs are showing. It makes the entire process flawless and effortless. You can also see the Financial Data Analysis.
Sample Data Analysis Excel
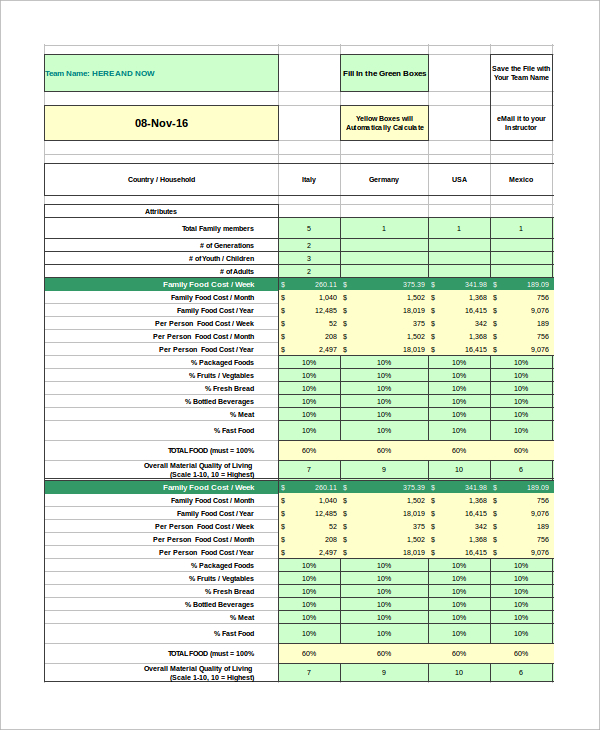
This is a great sample data analysis template that illustrates how it can be applied to any data. Its first sheet shows details about company and objectives to achieve, the second sheet is for data analysis, the following sheets are for charts of different types to determine critical factors from them. You can also see the Data Analysis Reports.
Types of Data Analysis
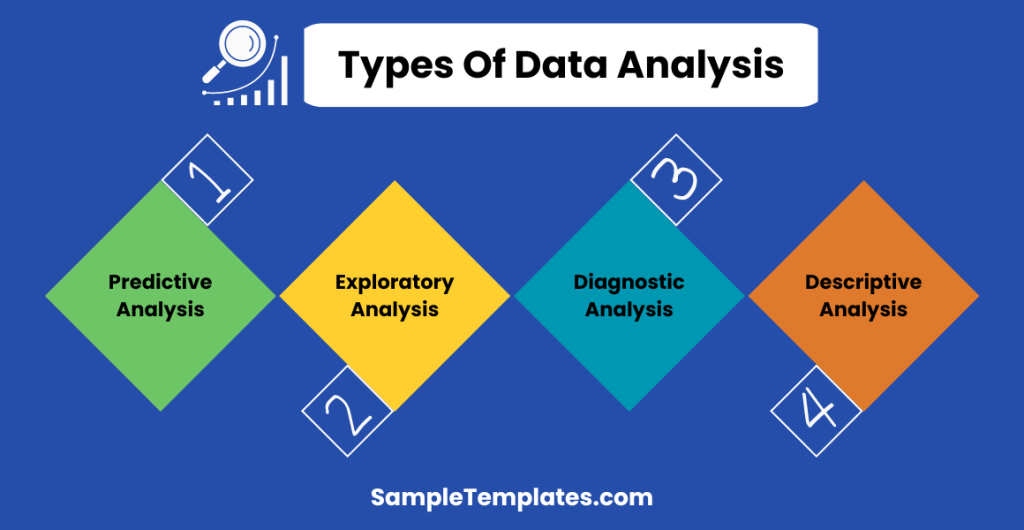
- Descriptive Analysis: Summarizes and describes the characteristics of a dataset, such as measures of central tendency, variability, and frequency distributions.
- Diagnostic Analysis: Investigates data to understand the cause of certain outcomes or behaviors, often used in troubleshooting or problem-solving.
- Exploratory Analysis: Uncovers patterns, trends, and relationships within data to generate hypotheses or insights for further investigation.
- Predictive Analysis: Uses historical data to make predictions about future events or trends, often employing statistical models or machine learning algorithms.
- Prescriptive Analysis: Recommends actions or strategies based on the results of predictive analysis, providing guidance on how to achieve desired outcomes.
- Causal Analysis: Determines cause-and-effect relationships between variables, identifying factors that influence specific outcomes.
- Qualitative Analysis: Analyzes non-numerical data such as text, images, or audio to identify themes, patterns, or insights.
- Quantitative Analysis: Involves the use of mathematical and statistical methods to analyze numerical data and derive meaningful insights.
Data Analysis Excel Format
This is a perfect template and format for general data analysis in Excel. The first sheet is to keep track of all the lists that will follow, the following sheets are graphs of all the data in different department or segregation, and complete data analysis based on them.
Data Analysis Process
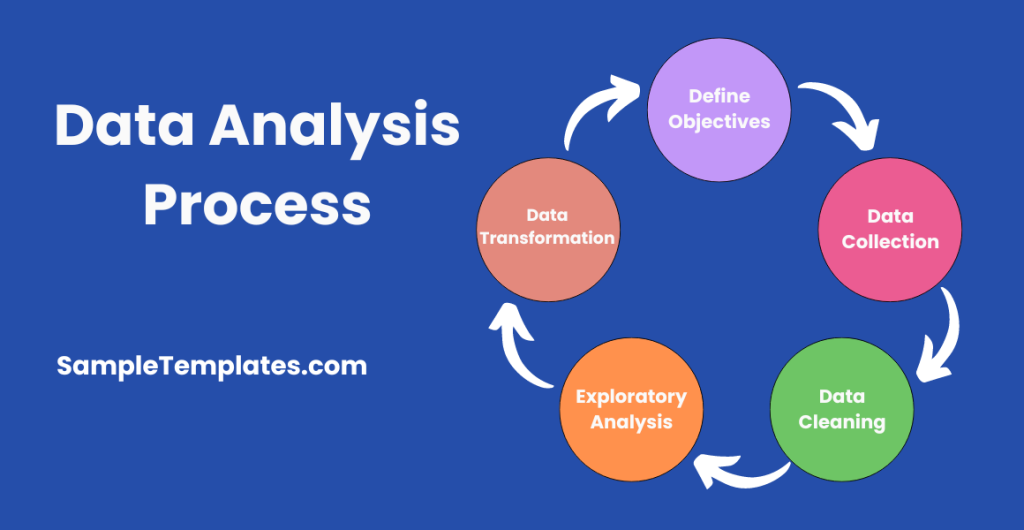
- Define Objectives: Clearly outline the goals and objectives of the analysis to guide the process effectively.
- Data Collection: Gather relevant data from various sources, ensuring its accuracy, completeness, and reliability.
- Data Cleaning: Preprocess the data to address issues such as missing values, outliers, and inconsistencies to ensure data quality.
- Exploratory Data Analysis (EDA): Explore the dataset visually and statistically to understand its characteristics, patterns, and relationships.
- Data Transformation: Perform transformations such as normalization, standardization, or feature engineering to prepare the data for analysis.
- Statistical Analysis: Apply statistical techniques to uncover insights, test hypotheses, and make inferences about the data.
- Modeling: Build predictive or descriptive models using machine learning algorithms or statistical methods to analyze the data and generate insights.
- Evaluation: Assess the performance of the models and validate their effectiveness in meeting the objectives of the analysis.
- Interpretation: Interpret the findings of the analysis in the context of the objectives, drawing actionable insights and recommendations.
- Visualization: Present the results of the analysis using visualizations such as charts in pdf, graphs, and dashboards to communicate findings effectively.
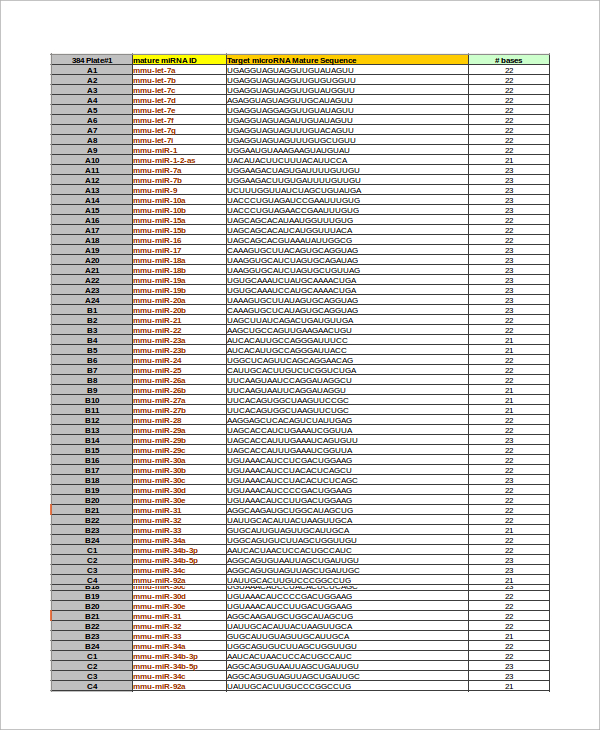
Input Data Analysis Excel Example
Targeted Audience
The targeted audiences for the data analysis Excel samples are the data analysts as well the corporates responsible for recording the relevant data. They can record the data and provide them to the data analysts who can make a quick analysis and provide relevant graphs and diagrams for better illustration.
There are different types of Sample Data Analysis and Graphs applicable for different industries and popular ones are provided above including the general ones for everyone’s use.
Test Data Analysis Outline in Excel
What Is data analysis?
Data analysis is the process of examining, cleaning, transforming, and interpreting data to uncover patterns, trends, and insights that inform decision-making, solve problems, and drive business outcomes.
What is an example of data analysis?
An example of data analysis is analyzing sales data to identify trends, such as peak selling times or popular products, helping businesses make informed decisions on inventory management and marketing strategies.
What does a data analyst do?
A data analyst collects, processes, and analyzes data to uncover insights, trends, and patterns. They interpret findings, develop reports, and provide actionable recommendations to support data-driven decision-making within organizations.
Does data analysis require coding?
Data analysis can be performed without coding using graphical tools or spreadsheet software. However, coding skills are beneficial for advanced analysis, automation, and custom solutions in data analysis tasks.
How to learn data analysis?
To learn data analysis, start by mastering essential statistical concepts and programming languages like Python or R. Practice with real-world datasets, engage in online courses, and collaborate on projects to gain practical experience.
What is data analysis in Excel?
Data analysis in Excel refers to the process of using Excel’s features and functions to analyze and interpret data. It involves tasks like sorting, filtering, summarizing, and visualizing data to derive insights and make informed decisions.
Data analysis is a rising trend and every company hires professional to analysis data to indicate the points of strengths and weakness, to do comparative Market Analysis Samples with the peers and understand the upcoming risks and points of opportunities. There are templates for general data analysis, comparative market analysis, environmental data analysis and much more.
If you have any DMCA issues on this post, please contact us.
Related Posts
FREE 11+ Cost Volume Profit Analysis Samples & Templates in PDF | MS Word
FREE 6+ Corporate Portfolio Analysis Samples in PDF
FREE 10+ Fault Tree Analysis Samples in PDF
FREE 10+ Comp Analysis Samples in PDF
FREE 10+ Fishbone Analysis Samples in PDF
FREE 10+ Individual Swot Analysis Samples in PDF
FREE 10+ 5 Year Analysis Samples in PDF
FREE 10+ Benefit Costs Analysis Samples in PDF
FREE 10+ Job Hazard Analysis Samples in PDF
FREE 10+ Primary Source Analysis Samples in PDF
FREE 10+ Critical Path Analysis Samples in PDF
FREE 10+ Competition Analysis Samples in PDF
FREE 10+ Activity Hazard Analysis Samples in PDF
FREE 10+ Risk Benefit Analysis Samples in PDF
FREE 10+ SEO Competitor Analysis Samples in PDF