
Quality management is one of the most critical parts of any business that aims to provide high-quality services and products to their clients which also adds value to their business process. Every company and organization from various industry sectors, ranging from manufacturing companies to healthcare institutions, utilizes quality control management tools to enhance their business processes. One of these tools is called the Fishbone Diagram which is used to find the root cause of an organization’s issue or problem.
FREE 10+ Fishbone Root Cause Analysis Samples
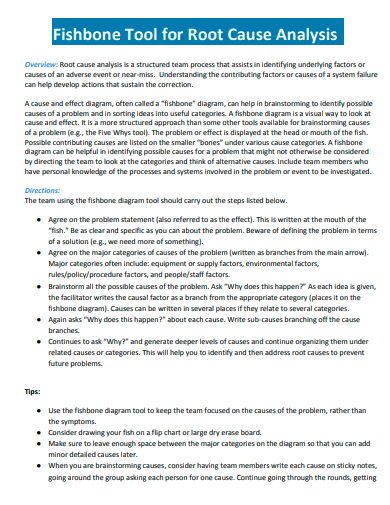
1. Fishbone Tool for Root Cause Analysis
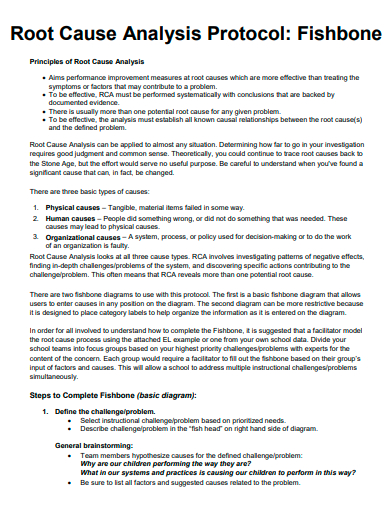
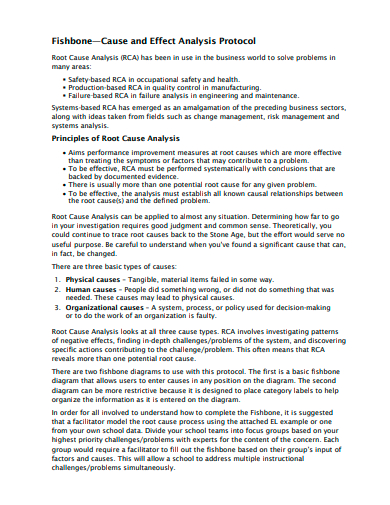
2. Fishbone Root Cause Analysis Protocol
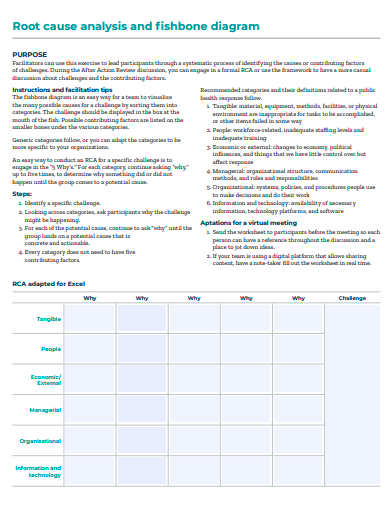
3. Fishbone Diagram Root Cause Analysis
4. Fishbone Root Cause Analysis in PDF
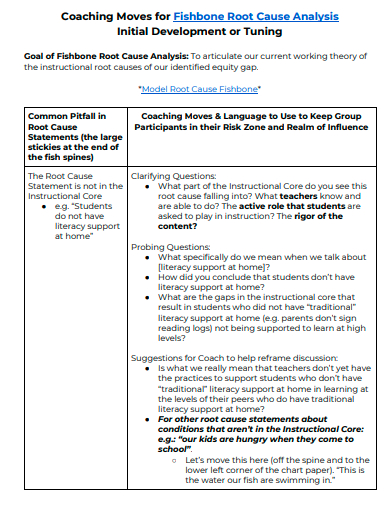
5. Coaching Fishbone Root Cause Analysis
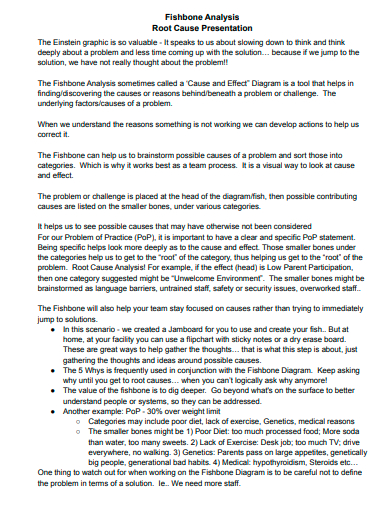
6. Fishbone Analysis Root Cause Presentation
7. Printable Fishbone Root Cause Analysis
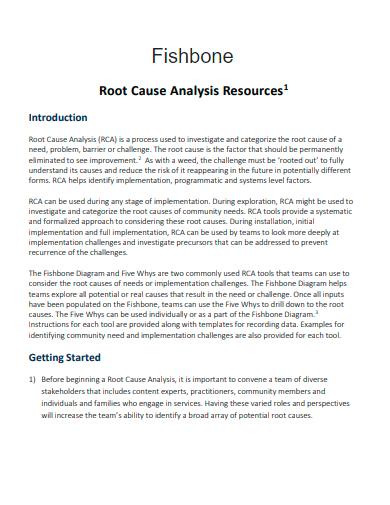
8. Fishbone Root Cause Analysis Resources
9. Formal Fishbone Root Cause Analysis
10. Sample Fishbone Root Cause Analysis
11. Standard Fishbone Root Cause Analysis
What is a Fishbone Root Cause Analysis?
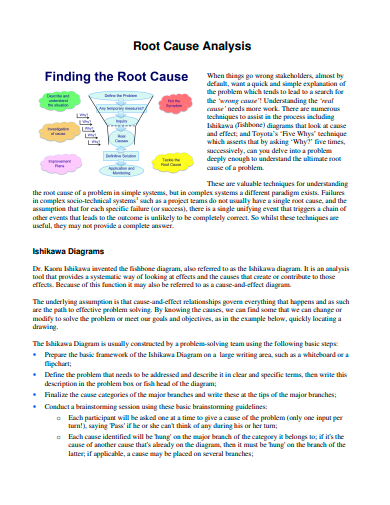
A fishbone root cause analysis, also known as an Ishikawa diagram, is a visual representation or a diagram of the root cause analysis that put an order in the cause-and-effect relationships of elements into categories. This diagram is a basic tool of quality control management that resembles a fish skeleton when laid on its side, hence its name. It is also used as a structured approach for brainstorming the cause of problems.
How to Create a Fishbone Root Cause Analysis?
The fishbone diagram is a root cause analysis method created as a quality control tool. The fishbone diagram, which resembles a fish laid on its side, displays the problem at its head and a backbone that lists the major contributing factors that can either bring failure or success to a business process. This tool is most effective when your team is solving a problem and visually organizing the information you have gathered.
Step 1: Determine the Issue or Problem
When creating a fishbone diagram, you need to first write down an accurate description of the problem you are currently facing and trying to solve. Through team meetings, think of the potential people involved, find out what the issue is, and the time and place it occurred. Draw a box on the right side of your paper with the problem statement inside it and create a horizontal line from this box protruding to the left, which will represent the spine of your diagram.
Step 2: Categorize the Causes
Categorize the causes of the current issue or problem which also refers to the factors that have the possibility of being a part of the problem. These factors can be a piece of equipment, system, materials, external forces, team members, and more. Draw a line off the spine of the diagram for each factor you identify.
Step 3: Determine Potential Causes
During your brainstorming session, you will be able to determine the potential causes of the issue that can also be related to the factors you have identified. Draw shorter lines of the diagram’s “bones” to visualize the possible causes.
Step 4: Analyze the Fishbone Diagram
After completing the fishbone diagram, it will display the potential causes of your problem statement. Through investigations and survey reports as well as the 5 Whys tool, you can further investigate the problem and determine the main contributing factor out of the potential causes you listed.
FAQs
What are the common categories in the fishbone diagram?
A fishbone diagram commonly displays categories for people, machines, methods, measurement, material, and environment which refers to the possible causes of the problem that a company is facing.
What are the advantages of making a fishbone diagram?
With a fishbone diagram, you can perform a thorough data analysis while preventing overlooked possible root causes. It is also easy to implement and create, allows your team to focus, and displays areas of weaknesses in a business process.
What are the useful tips when making a fishbone diagram?
When making a fishbone diagram, make sure to assemble or organize the appropriate team to perform the tasks, clearly define the major cause categories, use the 5 Whys tools, and consider using multi-voting strategies to determine the root cause from the team’s idea.
A fishbone root cause analysis is a method used by companies, businesses, and organizations to determine the major contributing factors causing an issue or problem within their team or enterprise. It uses the fishbone diagram which is a visual tool that visually displays every possible cause of an issue and enables you to get to the main or root cause of your problem while also allowing you to discover bottlenecks in your business processes or operations.
Related Posts
FREE 10+ Analysis of Alternatives Samples in PDF
FREE 10+ Failure Mode and Effects Analysis Samples in PDF
FREE 10+ Make or Buy Analysis Samples in PDF
FREE 11+ Cost Volume Profit Analysis Samples & Templates in PDF | MS Word
FREE 6+ Corporate Portfolio Analysis Samples in PDF
FREE 10+ Fault Tree Analysis Samples in PDF
FREE 10+ Comp Analysis Samples in PDF
FREE 10+ Fishbone Analysis Samples in PDF
FREE 10+ Individual Swot Analysis Samples in PDF
FREE 10+ 5 Year Analysis Samples in PDF
FREE 10+ Benefit Costs Analysis Samples in PDF
FREE 10+ Job Hazard Analysis Samples in PDF
FREE 10+ Primary Source Analysis Samples in PDF
FREE 10+ Critical Path Analysis Samples in PDF
FREE 10+ Competition Analysis Samples in PDF