
The fishbone analysis can be used in a variety of ways to identify the root cause of a user problem. It can be used to identify the cause of a problem that has already occurred, or it can be used to identify potential problems before they occur. It can also be used to identify the cause of a problem that is recurring, or to identify the cause of a problem that is persistent. One of the key benefits of the fishbone analysis is that it allows for a thorough and systematic examination of a problem.
FREE 10+ Fishbone Analysis Samples
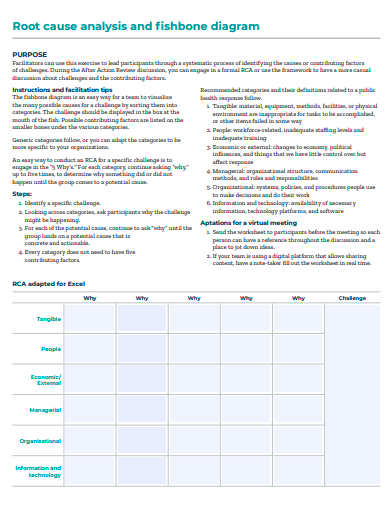
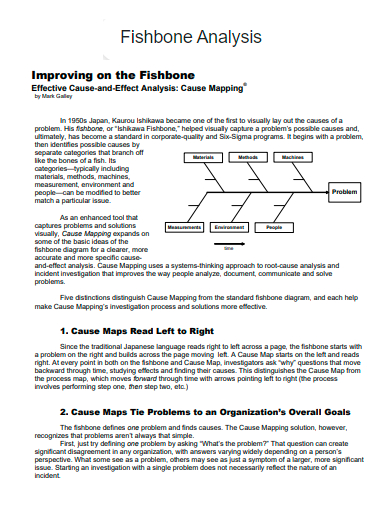
1. Fishbone Diagram Root Cause Analysis
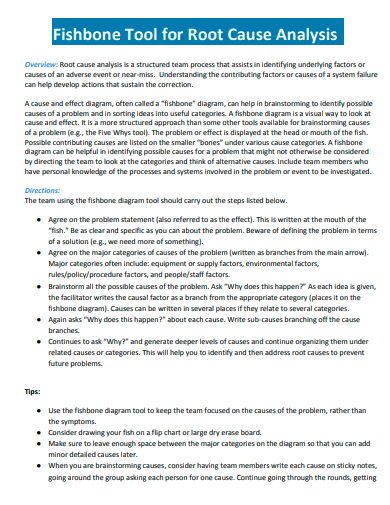
2. Fishbone Tool for Root Cause Analysis
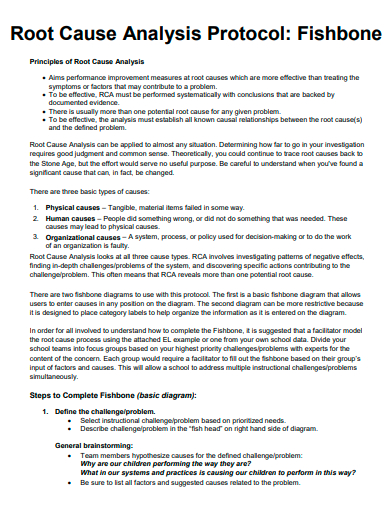
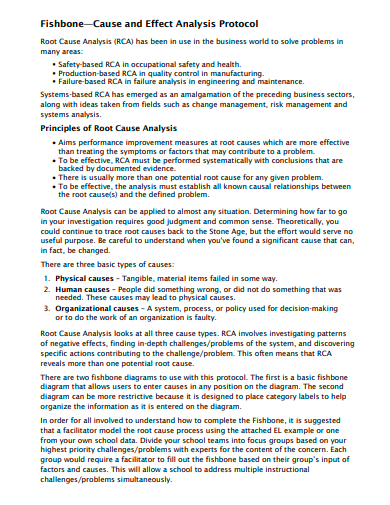
3. Fishbone Root Cause Analysis Protocol
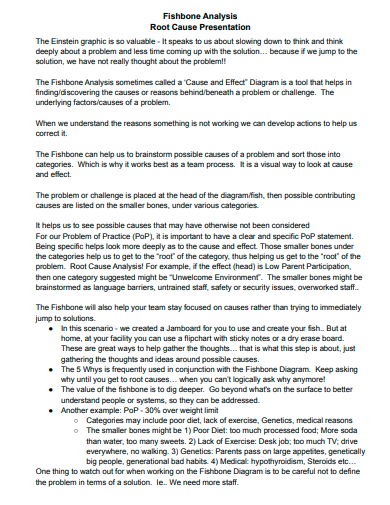
4. Fishbone Analysis Example
5. Printable Fishbone Analysis
6. Fishbone Analysis in PDF
7. Basic Fishbone Analysis
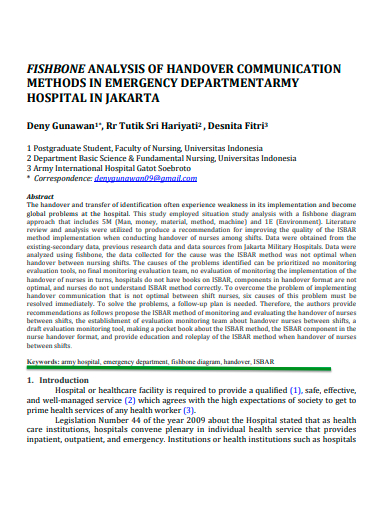
8. Fishbone Analysis of Handover Communication
9. Fishbone Diagram Analysis Tool
10. Formal Fishbone Analysis
11. Standard Fishbone Analysis
What is Fishbone Analysis?
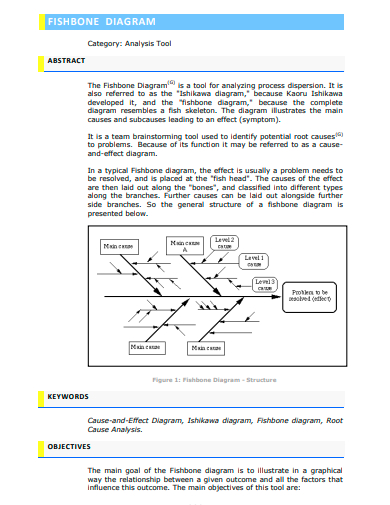
Fishbone analysis is a powerful tool for identifying the root causes of a problem or an effect. It is a structured and visually appealing way to organize and display the possible causes of a particular problem or event. The diagram is shaped like a fishbone, with the problem or effect being the head of the fish and the causes branching out from the spine of the fish. The Fishbone analysis is also known as Ishikawa diagram or cause and effect diagram, named after its creator Kaoru Ishikawa, a Japanese engineer and quality control expert.
How To Make a Fishbone Analysis?
The process of creating a fishbone diagram begins with clearly identifying the problem or effect that needs to be investigated. The team then brainstorms the possible causes of the problem, which are organized into categories, such as people, equipment placement, sample materials, work methods, and environmental situation. These categories are then represented by branches that extend out from the spine of the fish. To create a Fishbone analysis, also known as an Ishikawa diagram or cause and effect diagram, follow these steps:
Step 1- Identify the Problem
Determine the sample issue or the effect that has to be looked into. Determine exactly what the issue or consequence is that need fixing before proceeding. Put together a group. Collect a group of people who are familiar with the issue or the procedure.
Step 2- Draw the Diagram
On a whiteboard or piece of paper, draw a huge fishbone shape, then write the issue or effect at the head of the fish. Brainstorm the possible causes of the problem and organize them into categories such as people, equipment, materials, methods, and environment. The fishbone diagram will have its branches made up of these different types.
Step 3- Identify Causes
Determine the exact causes that fall under each category that are contributing to the issue. On the various branches of the fishbone diagram, we will write down each of these individual causes. After locating all of the contributing factors, the next step is to investigate each one in order to establish which ones are the most likely to have caused the issue.
Step 4- Implement Solution
Create and put into action solutions that will address the underlying cause or causes of the issue. Maintain vigilance over the situation to check whether or not the solutions that have been put into place are indeed solving the issue.
Who created the Fishbone analysis?
The Fishbone analysis was created by Kaoru Ishikawa, a Japanese engineer and quality control expert.
In what industries is Fishbone analysis commonly used?
Fishbone analysis is commonly used in industries such as manufacturing business, healthcare business, and service industries, but it can be applied in any industry where problem-solving and process improvement are needed.
How is Fishbone analysis different from other problem-solving tools?
Fishbone analysis is a visual storyboard tool that organizes the possible causes of a problem into categories, making it easy to identify the root cause. It’s different from other problem-solving tools because it allows for a team approach and a thorough and systematic examination of a problem.
The objective of a fishbone analysis is to determine which factor (or factors) are most directly responsible for a problem or effect by dissecting the issue into its component components and classifying the various factors that could be to blame.
Related Posts
FREE 10+ Analysis of Alternatives Samples in PDF
FREE 10+ Failure Mode and Effects Analysis Samples in PDF
FREE 10+ Make or Buy Analysis Samples in PDF
FREE 10+ Fishbone Root Cause Analysis Samples in PDF
FREE 11+ Cost Volume Profit Analysis Samples & Templates in PDF | MS Word
FREE 6+ Corporate Portfolio Analysis Samples in PDF
FREE 10+ Fault Tree Analysis Samples in PDF
FREE 10+ Comp Analysis Samples in PDF
FREE 10+ Individual Swot Analysis Samples in PDF
FREE 10+ 5 Year Analysis Samples in PDF
FREE 10+ Benefit Costs Analysis Samples in PDF
FREE 10+ Job Hazard Analysis Samples in PDF
FREE 10+ Primary Source Analysis Samples in PDF
FREE 10+ Critical Path Analysis Samples in PDF
FREE 10+ Competition Analysis Samples in PDF