
In CVP analysis, a company business considers its fixed costs, which are expenses that do not change with changes in sales quote volume, and its variable costs, which increase or decrease with changes in sales volume. The sales business price and the sales volume are also considered in this gap analysis. The goal of CVP analysis is to determine the breakeven point, which is the point at which total revenue equals total cost, and to evaluate the impact of changes in sales volume and independent costs on the company’s business profit.
FREE 11+ Cost Volume Profit Analysis Samples & Templates in PDF | MS Word
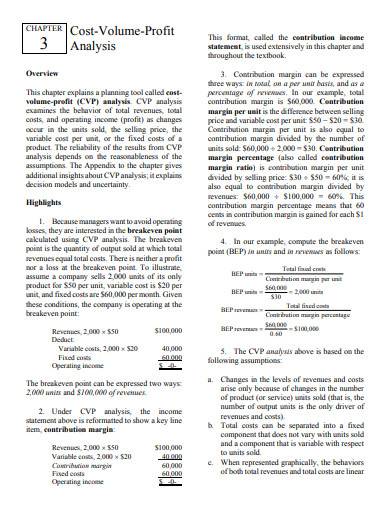
1. Sample Cost Volume Profit Analysis Template
2. Basic Cost Volume Profit Analysis Template
3. Company Cost Volume Profit Analysis Template
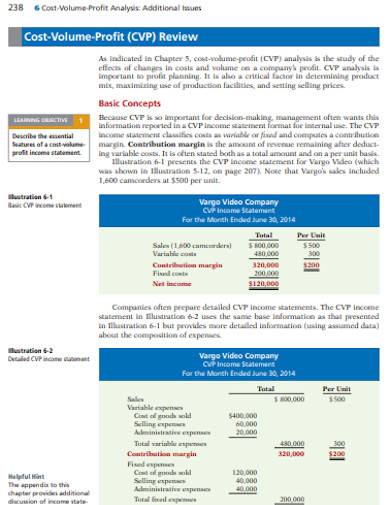
4. Accounting Management Cost Volume Profit Analysis
5. Simple Cost Volume Profit Analysis Template
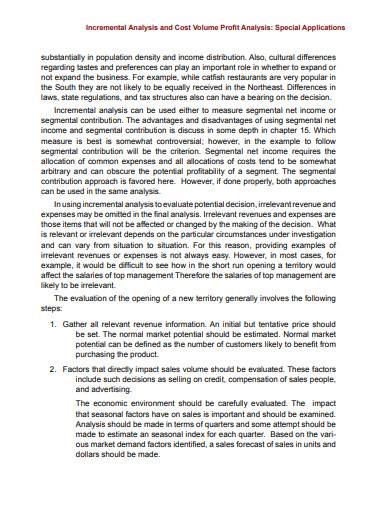
6. Incremental Analysis and Cost Volume Profit Analysis
7. Standard Cost Volume Profit Analysis Template
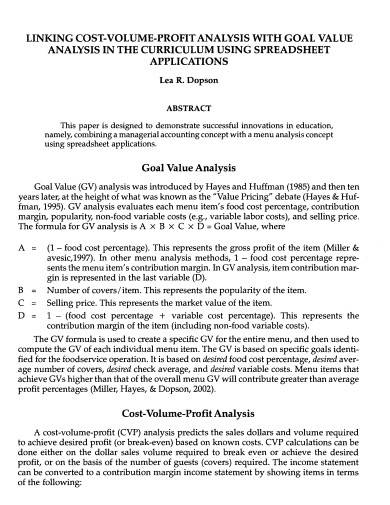
8. Linking Cost Volume Profit Analysis Template
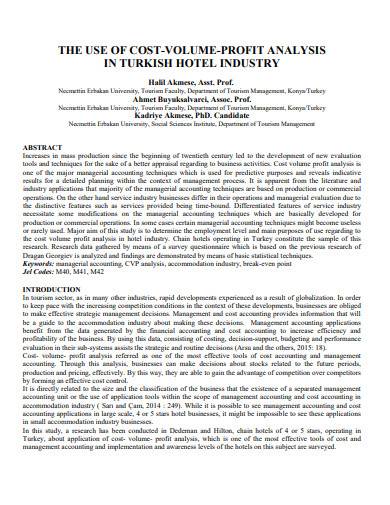
9. Hotel Cost Value Profit Analysis Template
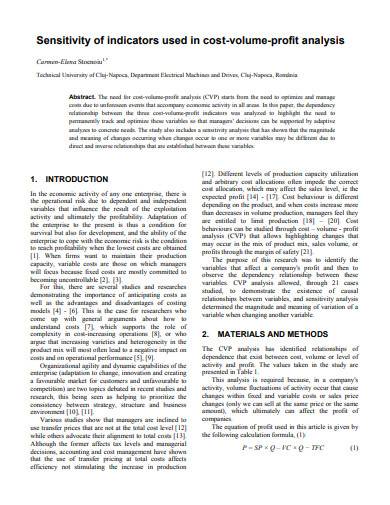
10. Sensitivity of Indicators in Cost Volume Profit Analysis
11. Formal Cost Volume Profit Analysis Template
12. Cost Volume profit Analysis Format
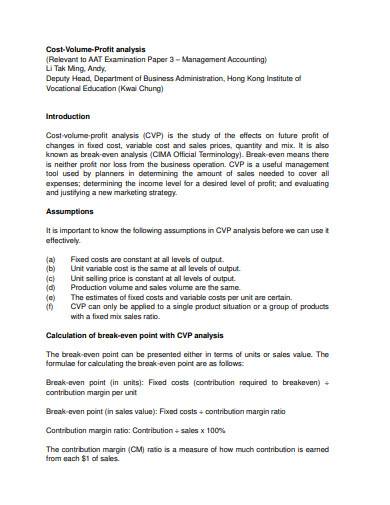
What Is Cost Volume Profit Analysis?
Cost-Volume-Profit (CVP) analysis is a method used in managerial accounting business to evaluate the impact of changes in sales volume and cost structure on a company’s operating profit and breakeven point. It helps account managers determine the level of business sales required to cover all costs and achieve a desired level of profit. CVP analysis takes into account fixed costs, variable costs, sales price, and volume to determine the relationship between changes in these factors and the company’s volume profit.
How To Make a Cost Volume Profit Analysis?
One of the key advantages of CVP analysis is that it allows companies to see how changes in sales volume and costs will affect their bottom line. For example, if a company is considering increasing its sales price, it can use CVP analysis to determine the impact of this change on its profits. Similarly, if a company is considering reducing its costs, it can use CVP analysis to determine the impact of this change on its breakeven point. Cost-Volume-Profit (CVP) analysis is a systematic process that involves the following steps:
Step 1- Gather Data
Start by gathering information on all of your costs, including fixed costs and variable costs for each unit of product sold. This includes raw materials, labor, overhead, etc. Determine selling price: Establish the price at which you plan to sell each unit of product.
Step 2- Calculate Contribution Margin
The contribution margin is calculated by subtracting the variable costs per unit from the selling price per unit. The contribution margin represents the amount that contributes to covering fixed costs and generating profit. Fixed costs are costs that do not change with the level of production or sales, such as rent, salaries, insurance, etc.
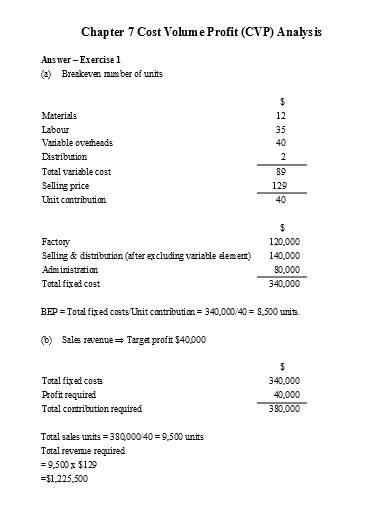
Step 3- Calculate Points
The break-even point is the point at which total revenue equals total costs, including both fixed and variable costs. To calculate the break-even point, divide fixed costs by the contribution margin. This will give you the number of units that must be sold to reach the break-even point.
Step 4- Plot the Graph
Create a CVP graph with the horizontal axis representing units sold and the vertical axis representing total costs and total revenue. Plot the fixed costs, variable costs, and total revenue lines on the graph to visually see the relationship between costs and revenue at different levels of sales.
What are the components of CVP analysis?
The components of CVP analysis include fixed costs, variable costs, selling price, contribution margin, and break-even point.
What is the break-even point in CVP analysis?
The break-even point is the point at which total revenue equals total costs, including both fixed and variable costs. At this point, a business is neither making a profit nor incurring a loss.
How often should a CVP analysis be updated?
A CVP analysis should be updated regularly to reflect changes in costs, prices, and sales levels to ensure the accuracy of the results and to make informed business decisions.
Finally, use the CVP analysis to make informed business decisions, such as determining the optimal production and sales levels, setting prices, and making changes to production processes to reduce costs.
Related Posts
FREE 10+ Literary Analysis Samples in PDF
Sample Data Analysis Templates
FREE 10+ Article Analysis Samples in PDF
FREE 11+ Workload Analysis Samples in PDF | Excel | MS Word
FREE 21+ Construction Analysis Samples in MS Word | Google Docs | PDF
FREE 14+ Construction Cost Analysis Samples in PDF | MS Word
FREE 13+ Construction SWOT Analysis Samples in MS Word | Google Docs | PDF
FREE 13+ Service Business Proposal Templates in PDF | MS Word | Pages | Google Docs
FREE 9+ Character Analysis Templates in MS Word | PDF
FREE 10+ Process Hazard Analysis Samples in PDF
FREE 10+ Value Chain Analysis Samples in MS Word | Google Docs | Apple Pages | PDF
FREE 10+ Turnover Ratio Analysis Samples and Templates in PDF
FREE 10+ Soar Analysis Samples in PDF
FREE 10+ Rhetorical Analysis Samples in PDF
FREE 10+ Analysis of Alternatives Samples in PDF