
10+ Statistical Analysis Samples
Analyzing statistics has always been very important — may it be scientifically, economically, or nationally. In the field of science, statistics teaches experts on how to efficiently design and analyze experiments while in business, it helps companies in identifying trends and patterns to enhance sales. Of course, statistical analysis are also used by the government because it enhances their ability to establish suitable policies, manage the economy and implement social development reform plans, track people’s living conditions, and report progress to the public using solid evidence. Statistical analysis is done with the use of a software, which would allow users to perform more complex studies by offering extra tools for data set structure and interpretation, as well as data presentation. Needless to say, it is complicated enough to analyze data, so we hope our free, customizable Statistical Analysis Samples would help! If you are interested, keep on reading!
1. Statistical Analysis Sample
2. Printable Statistical Analysis
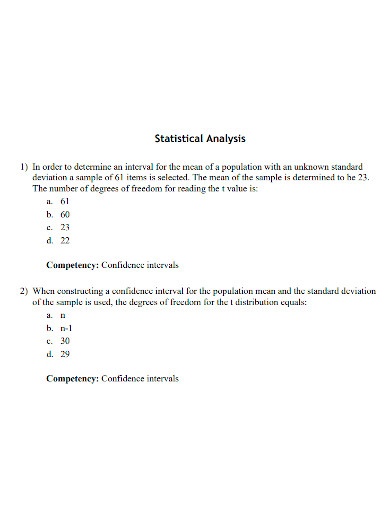
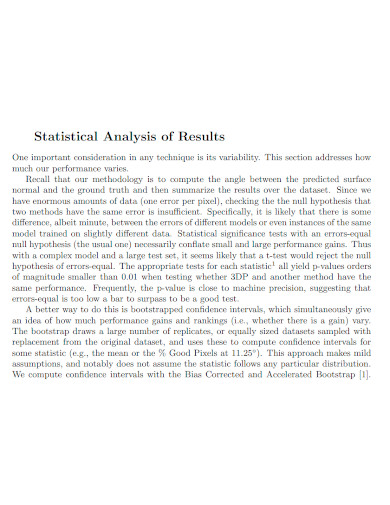
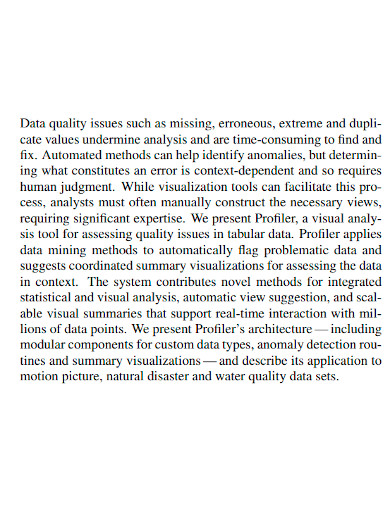
3. Statistical Results Analysis
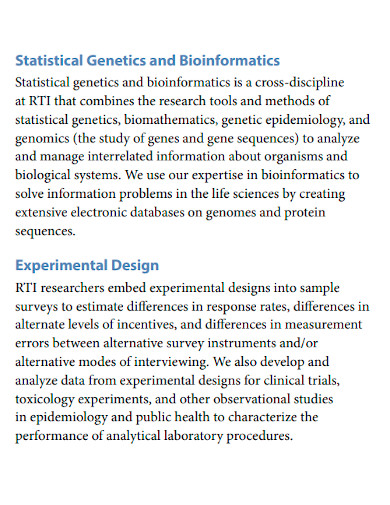
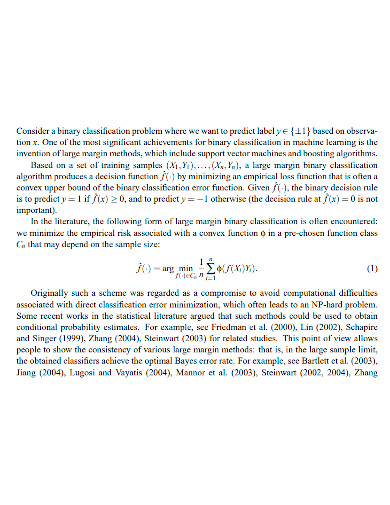
4. Statistical Design and Analysis
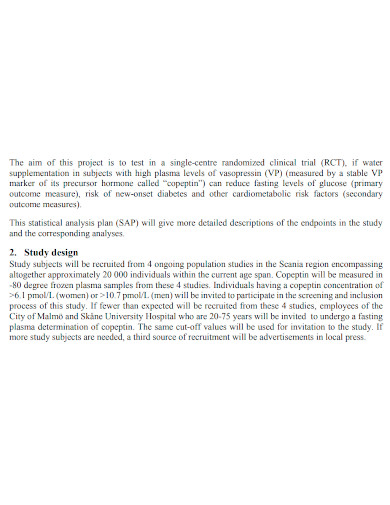
5. Statistical Analysis Plan
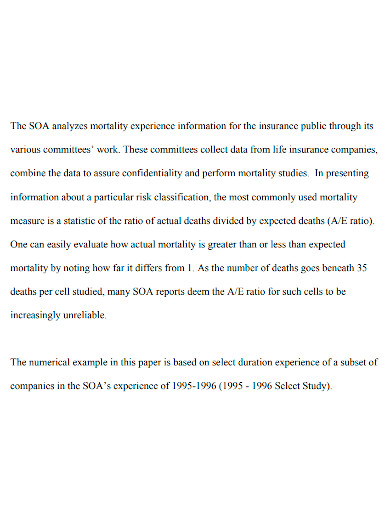
6. Financial Data Statistical Analysis
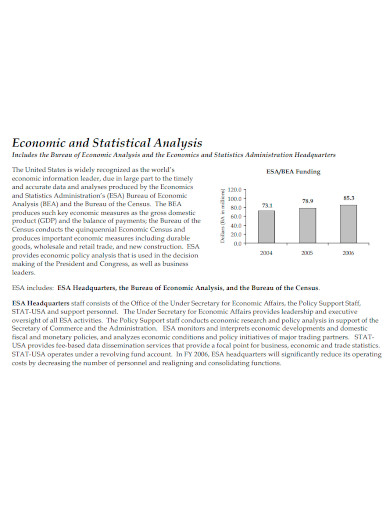
7. Economic and Statistical Analysis
8. Statistical Analysis Format
9. Professional Statistical Analysis
10. Integrated Statistical Data Analysis
11. Advanced Statistical Analysis
What is A Statistical Analysis?
A Statistical Analysis is a methodical process done by researchers and even students. It uses data for analyzing patterns, connections and trends. Statistical Analysis starts by planning considerately, formulating hypotheses, doing research, collecting data, testing the hypotheses, and lastly, drawing a conclusion. It describes the nature of the data to be analyzed, investigates the data’s relationship to the underlying population, develops a model to summarize an understanding of how the data relates to this, verifies the model’s validity, and uses predictive analytics to run scenarios that will guide future actions. This is to show us how likely it is that a study’s findings happened by chance.
How to Make a Statistical Analysis
Aside from the variety of free Statistical Analysis templates provided above, you can also try to make one of your own. If you’re interested in creating a statistical analysis, here are the following basic steps you should consider:
1. Plan and Hypothesize.
Don’t forget to include in your planning how you would design your research and how the variables would be measured. And because the main objective of your statistical analysis is to analyze the connection of variables in a population, you would have to make an educated guess (your hypothesis) which will then be proven or disproven later on in the process. There are also different types of hypotheses to consider.
2. Gather Information and Synthesize.
You may use other samples where you can gather data from, but you must keep in mind to follow proper sampling procedures. Make sure that the population is being represented in this sample. There are also different types of sampling that you may want to look up. In planning on picking out participants, consider appropriate factors. These would include the schedule, time, resources, contact details, and means. You can examine your data and use descriptive statistics to summarize them now that you have collected them. In examining, consider the display and organization of the data. Also, take note of the connection between variables. It is also important to calculate measures.
3. Check hypotheses or create estimations.
There are different types of estimation to use, and it depends on your main objective. Also, don’t worry if there are mistakes in your estimations, as that is to be expected. You must then give an interval. In checking your hypotheses, make use of data. There are different statistical tests which will be based on your research methodology, questions, sampling, and data characteristics.
4. Analyze your findings.
The basic criterion for drawing conclusions in hypothesis testing is statistical significance. Statistically significant outcomes are thought to be unlikely to have occurred by coincidence. If the null hypothesis is true in the population, such a finding has a very small likelihood of occurring.
FAQ
What is the purpose of statistical analysis?
The most common method for examining quantitative research data is statistical analysis. It use probability and models to assess population predictions based on sample data. What makes descriptive statistics different from inferential statistics? The properties of a data set are summarized using descriptive statistics.
What is the distinction between statistical analysis and data analysis?
By analyzing the data from a sample, statistical analysis is utilized to acquire a better knowledge of a wider population. The process of analyzing, presenting, and reporting data in a way that is understandable to non-technical individuals is known as data analysis.
What are statistical skills?
The gathering, organization, analysis, and interpretation of numerical data are all examples of statistical skills.
Statistics gives us an idea on what’s happening around us so that we can do something about it. It makes informed citizens, effective leaders, and successful businesspeople. It contributes to progress in science, which could then be progress of the whole world. Therefore, analyzing statistics is a very vital but also difficult task. Use our customizable Statistical Analysis Samples now to make your job easier!
Related Posts
FREE 10+ Rhetorical Analysis Samples in PDF
FREE 10+ Analysis of Alternatives Samples in PDF
FREE 10+ Failure Mode and Effects Analysis Samples in PDF
FREE 10+ Make or Buy Analysis Samples in PDF
FREE 10+ Fishbone Root Cause Analysis Samples in PDF
FREE 11+ Cost Volume Profit Analysis Samples & Templates in PDF | MS Word
FREE 6+ Corporate Portfolio Analysis Samples in PDF
FREE 10+ Fault Tree Analysis Samples in PDF
FREE 10+ Comp Analysis Samples in PDF
FREE 10+ Fishbone Analysis Samples in PDF
FREE 10+ Individual Swot Analysis Samples in PDF
FREE 10+ 5 Year Analysis Samples in PDF
FREE 10+ Benefit Costs Analysis Samples in PDF
FREE 10+ Job Hazard Analysis Samples in PDF
FREE 10+ Primary Source Analysis Samples in PDF