
Every research study and report needs to have an analysis of the data they gathered. The two main types of analysis are quantitative and qualitative analysis methods. Both methods have their own individual and different process but this article will focus more on the qualitative data analysis process aspect. Qualitative analysis is usually done in research that doesn’t involve any statistics or numbers; this is more to understand a certain study based on observation. To know more about qualitative data analysis, keep reading the article below.
3+ Qualitative Data Analysis Report Samples
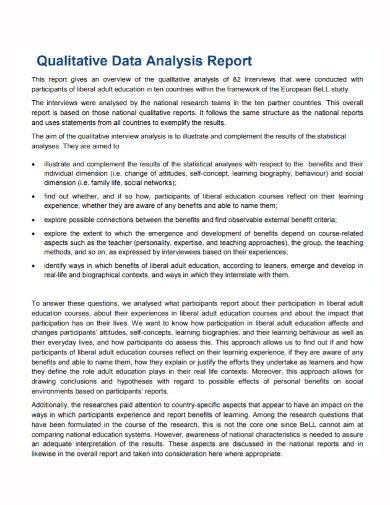
1. Qualitative Data Analysis Report
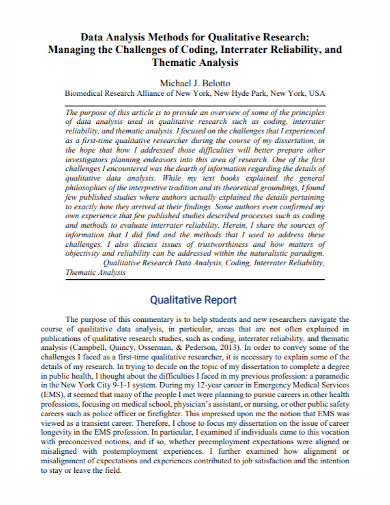
2. Qualitative Research Data Analysis Report
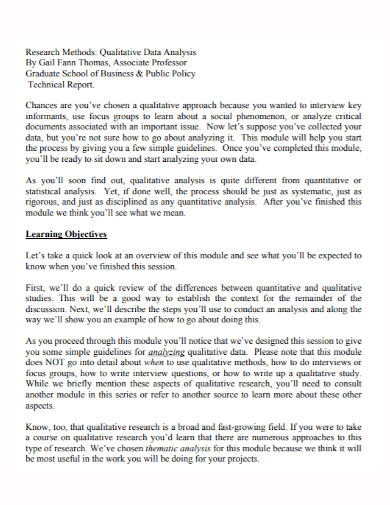
3. Qualitative Data Analysis Technical Report
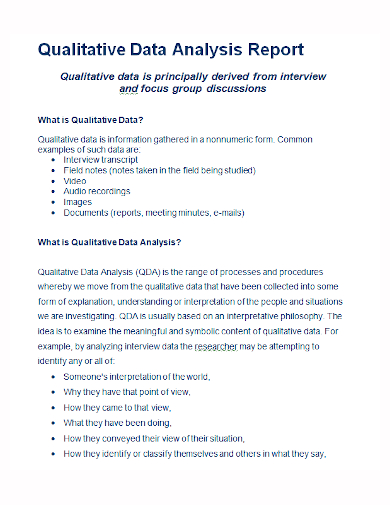
4. Sample Qualitative Data Analysis Report
What is Qualitative Data Analysis?
Qualitative data analysis is the process of using written data findings. Unlike quantitative data, qualitative data don’t need any formulas, recipes, or rules for this process, instead, the researcher will do a case study approach, theory-based approaches, and collaborative and participatory forms of analysis. This analysis aims to always produce good quality findings.
How to Analyze Qualitative Data
1. Gather and Organize your Data
The first step in analyzing your qualitative data is to gather all of the comments and feedback from your respondents that you want to analyze. So if your data is input in different formats such as on paper or in online forums and surveys, print them out including your transcripts from interviews, your notes that you took during your gathering, and then organize all of these to pick the important contents and put them in one single document and chuck away the unimportant ones.
2. Review the Data
The next step is to read the important details of your data several times to get a sense of their contents. Take note of your initial understanding, comments or ideas, or questions you have regarding them. You will use these for the next step.
3. Create Initial Codes
The next step in the analysis process is to code the comments and questions you wrote and decide how each one should be organized. You can look for a pre-defined set or list of issues and themes or unpack themes from the data without expecting about they are about. You can use highlighters, post-it notes, or concept maps to aid you in connecting with your data.
4. Review the Initial Codes and Combine Them Into Themes
The next step is where you will identify the recurring themes, language, opinions, and beliefs related to your research topic. To guide you in formulating your final analysis of your data that you will then present in your report, you can follow these guide questions:
- Which are the most used codes or themes? When you identified these, you need to visually present them well to identify the most important areas.
- How did your respondents react to your data gathering formats? Were there any differences in their views and opinions based on the submission type?
- Which issues are common to the different demographics of your respondents? And are there any relationships between issues?
5. Present Your Findings Cohesively
This step is where you finally report your findings and your learnings based on your analysis. Include the purpose of your research and other supporting content when you report your findings. Make sure to organize the data well and be clear and concise to make it easy for your readers to understand them. Make sure to avoid putting in any fabricated findings or else your study will be invalid.
FAQs
What is the difference between qualitative and quantitative data?
Quantitative data is information about measuring quantities that involve numbers, while qualitative data is descriptive and can only be observed.
What are the most commonly used qualitative data analysis methods?
The most commonly used qualitative data analysis methods are qualitative content analysis, narrative analysis, and discourse analysis.
What are the different types of qualitative research designs?
Some examples of qualitative research designs are grounded theory, ethnographic, narrative research, historical, case studies, and phenomenology.
What are the strengths of qualitative research?
Qualitative research can help issues get examined in great detail. Since qualitative data is usually obtained through an interview process, the data are not restricted to specific questions and can be redirected by the researcher in real-time through additional questions based on the answers. Furthermore, the research framework in qualitative research is flexible since it can be quickly revised as new information comes up.
Before you report your findings, don’t forget to review your findings, your wording, and the tone of the whole report. This also will ensure that you didn’t leave any important information out. Don’t forget to proofread for any grammatical or spelling mistakes and change those into their proper grammar and spelling. To help you get started on your own qualitative data analysis for your report, download our free sample templates provided above as your reference.
Related Posts
Sample Chemistry Lab Reports
School Accomplishment Report Samples & Templates
Field Report Samples & Templates
Sample Science Project Reports
Business Report Samples & Templates
Survey Reports Samples & Templates
Sample Feasibility Reports
Psychological Assessment Report Samples [ Clinical, Child, Intake ]
Report Format Samples & Templates
Acknowledgement for Internship Report Samples [ Hotel, Hospital, Teaching ]
Field Trip Report Samples [ Agriculture, Educational, Environmental ]
Student Counseling Report Samples
Narrative Accomplishment Report Samples [ Science, Teacher, Reading ]
Sample Acknowledgment Report Templates
Internship Narrative Report Samples