
Graphs samples are powerful tools used in various fields to visually represent and business data analysis. They provide a clear and concise way to convey complex information and patterns, making it easier for researchers, scientists, and decision-makers to interpret and make informed decisions. While graphs with data points and trend analysis are prevalent, there is also an essential role played by “blank graphs” or graphs with no plotted data. Blank graphs provide a visually appealing and easily understandable way to present complex data. They allow businesses to present information in a concise and clear manner, making it easier for stakeholders, including executives, managers, and investors, to comprehend key insights and trends quickly. Blank graphs play a crucial role in tracking business performance evaluation against predefined goals and KPIs samples (Key Performance Indicators). By plotting data on blank graphs regularly, businesses can monitor their progress, identify areas of improvement, and adjust their operations management to align with their objectives.
FREE 15+ Blank Graph Samples
1. Sample Blank Bar Graph Template

2. Sample Blank Line Graph Template
3. Sample Blank Graph Basic Template
4. Sample Blank Graph for Crystal Drop Cover Template
5. Sample Blank Class Profile Graph Template
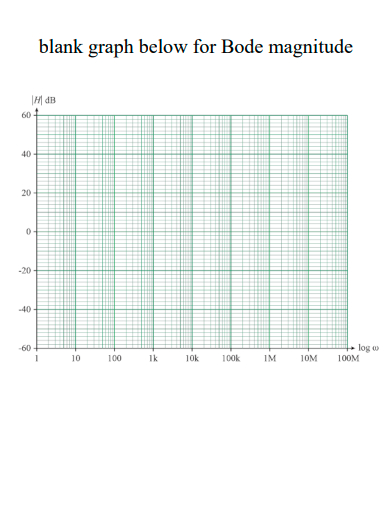
6. Sample Blank Graph for Bode Magnitude Template
7. Sample 20×20 Blank Graph Paper Template
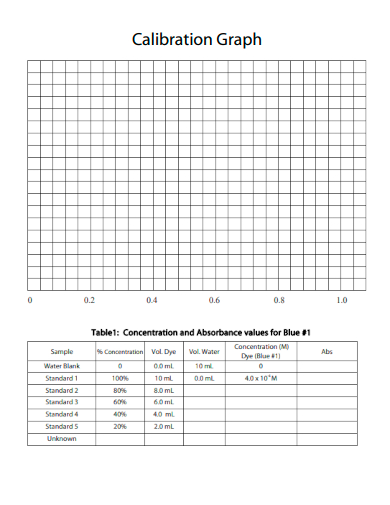
8. Sample Blank Calibration Graph Template
9. Sample Blank Graph Formal Template
10. Sample Blank Block Graph Template
11. Sample Blank Circle Graph Template
12. Sample Blank X & Y Axis Graph Template
13. Sample Blank Graph Form Template
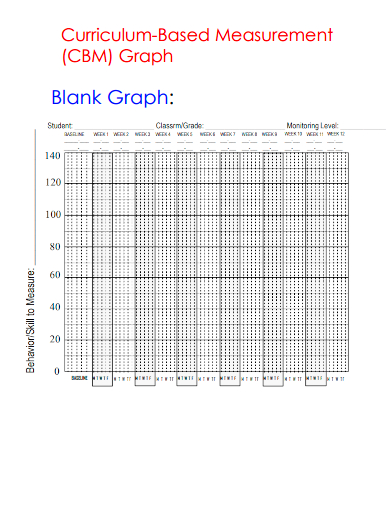
14. Sample CBM Blank Graph Template
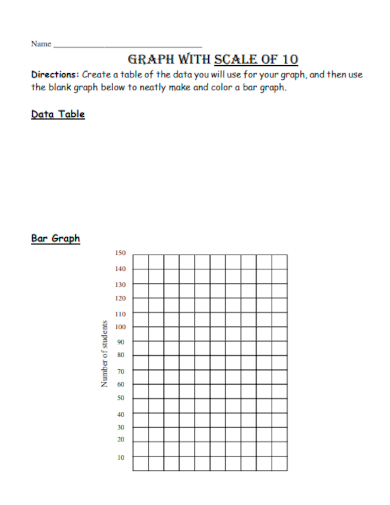
15. Sample Blank Graph with Scale of 10 Template
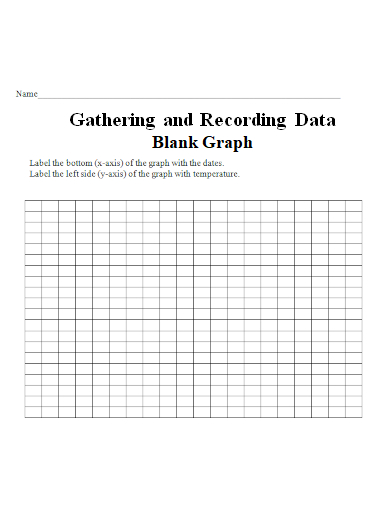
16. Sample Recording Data Blank Graph Template
What is Blank Graph?
A blank graph serves as a fundamental building block in data analysis and allows researchers, analysts, and educators to prepare for the visualization of data. It provides a structured framework on which data points or statistical information can later be plotted to create meaningful visual representations, such as line graphs, bar graphs, scatter plots, pie charts, or any other type of graph used for data visualization.
How To Make Blank Graph?
The use of blank graphs is prevalent in various fields, including mathematics, statistical analysts, business, economics, sciences, and education. Researchers and analysts typically start with a blank graph to organize and analyze data visually, making it easier to observe trends, patterns, and relationships between variables. Creating a blank graph is a straightforward process, and it can be done using various software tools or even by hand. Here’s a step-by-step guide on how to make a blank graph:
Step 1- Determine the Type of Graph
Decide on the type of graph you want to create. Common types include line graphs, bar graphs, pie charts, scatter plots, and more. The choice of graph depends on the type of data you have and the specific visualization you want to achieve.
Step 2- Gather Data and Define Axes
If you have data that you want to plot on the graph, gather the information and organize it appropriately. Next, determine the range and labels for both the x-axis (horizontal axis) and y-axis (vertical axis). These labels should correspond to the variables you are plotting.
Step 3- Set Up the Graph
If using software, open a new graph document or worksheet. Adjust the size and style of the graph as needed. Ensure that the axes are properly labeled with the variable names, and the scale is appropriate for the data you want to plot.
Step 4- Plot the Data Points (Optional)
If you have specific data points to plot on the graph, you can do so after setting up the blank graph. Use the corresponding x and y values to place the data points on the graph accurately. If you only want a blank graph without any data points, you can skip this step.
Why do we use blank graphs?
Blank graphs serve as a foundation for data analysis and visualization. They allow researchers and analysts to prepare for plotting data, compare data from different sources, detect anomalies, and plan experiments.
Which types of graphs can be made blank?
Blank graphs can be created for various types of graphs, such as line graphs, bar graphs, scatter plots, pie charts, histograms, and more. The choice depends on the data and the visualization required.
How can I create a blank graph?
You can create a blank graph using software tools like Microsoft Excel, Google Sheets, Python with libraries like Matplotlib, or online graphing tools. Alternatively, you can draw one manually using graph paper.
In conclusion, blank graphs hold a crucial place in data analysis and visualization. They provide a solid foundation for plotting data, facilitate comparative analysis, and aid in detecting anomalies and outliers. Furthermore, blank graphs play a vital role in experimental design and education, contributing to a more comprehensive understanding of data and its implications. As we continue to embrace the power of data-driven decision-making, the significance of blank graphs in enabling accurate and insightful analysis will only grow stronger.
Related Posts
FREE 5+ Sample Bubble Chart Templates in PDF MS Word
FREE 5+ Sample Semilog Graph Paper Templates in PDF MS Word
FREE 10+ Plot Diagram Samples in MS Word Pages | Google Docs ...
FREE 16+ Printable Lined Papers in PDF MS Word
FREE 7+ Printable Lined Paper Samples in PDF MS Word
FREE 27+ Isometric Papers in PDF MS Word
FREE 6+ Diamond Chart Templates in PDF
FREE 7+ Sample Calligraphy Papers in PDF MS Word
FREE 6+ Sample Excel Graph Paper Templates in Excel PDF
FREE 19+ Unit Circle Charts Templates in PDF MS Word
FREE 6+ Grid Paper Templates in MS Word PDF
FREE 6+ Sample Graph Paper With Axis in PDF
FREE 8+ Notebook Papers Samples in PDF MS Word
FREE 27+ Sample Organizational Chart Templates in PDF MS ...
FREE 7+ Sample T Chart Templates in PDF MS Word