
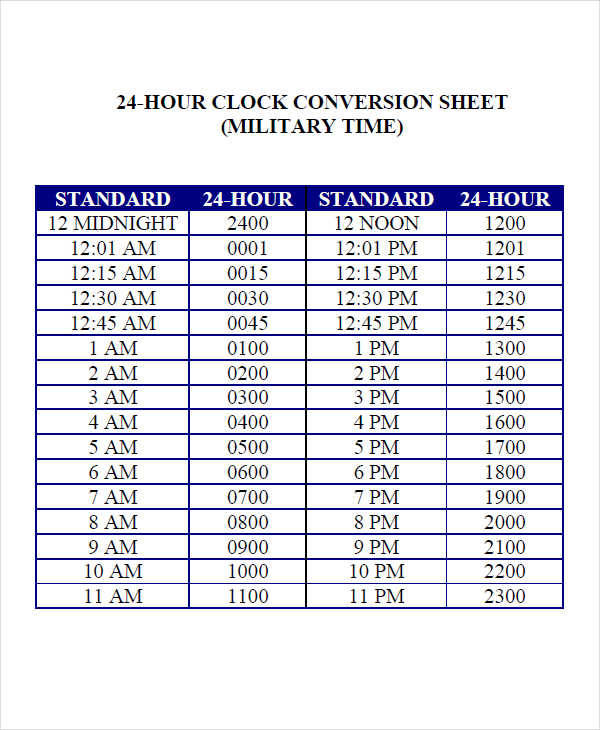
Well, if you lived in the military, the term would be “Military Time” instead of standard time. Military time is usually counted in a 24-hour time format whereas standard time is counted in a standard 12-hour time format. Now, a time chart is a list of time available during a day. Let’s say, in standard time it is 01:30 p.m. while in military time it is 1330.
Now, you may notice that there is a form of Time Conversion being used when differentiating the military time chart and the standard time chart. This is simply due to each group’s preference on how they wish to view time. However, there are some advantages to using certain time formats. As you continue reading, you will be able to know what those advantages are.
24-Hour Time Chart Samples
24-Hour Clock Time Conversion Chart
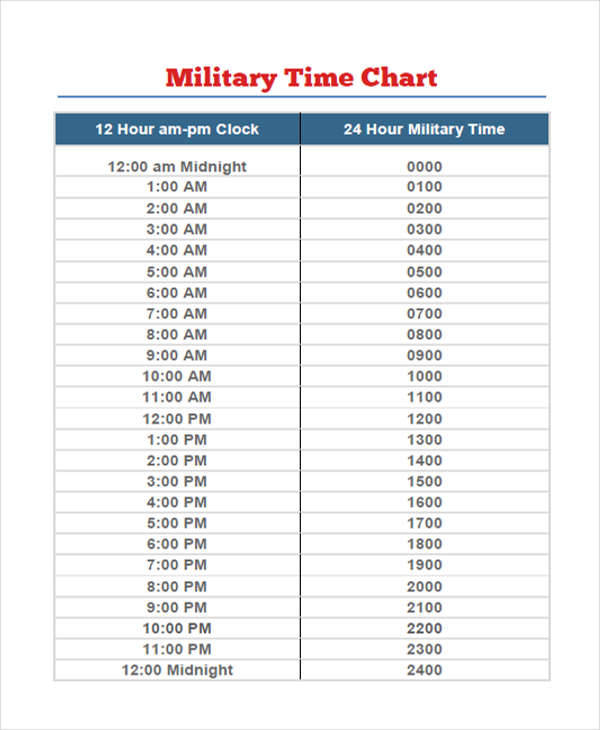
24 Hour Military Time Chart
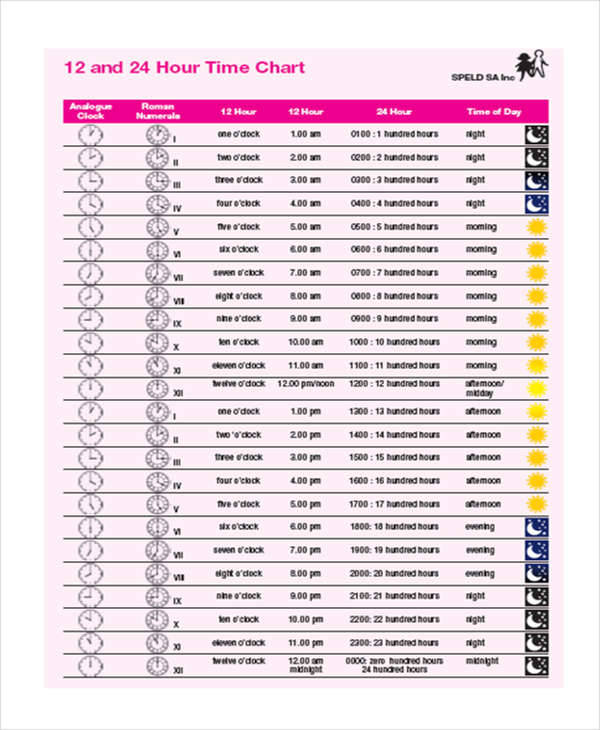
Sample 24 Hour Time Chart
Military Time Charts
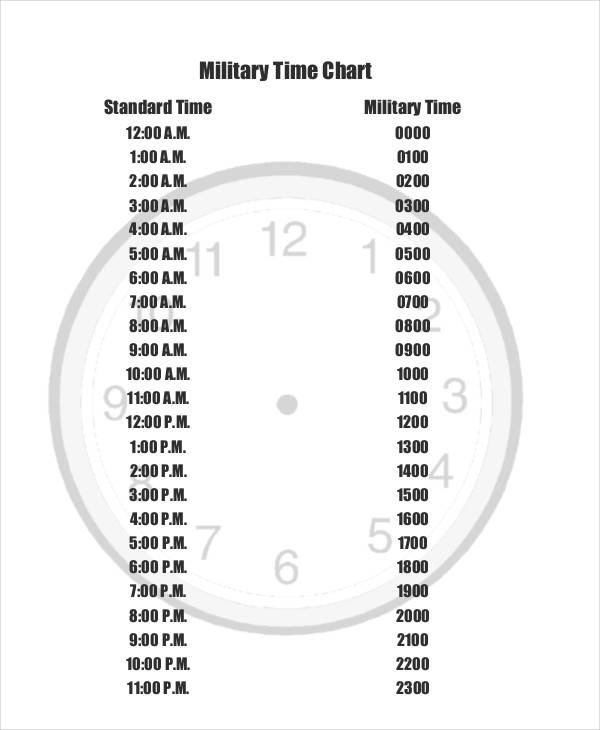
Military Time Clock Chart
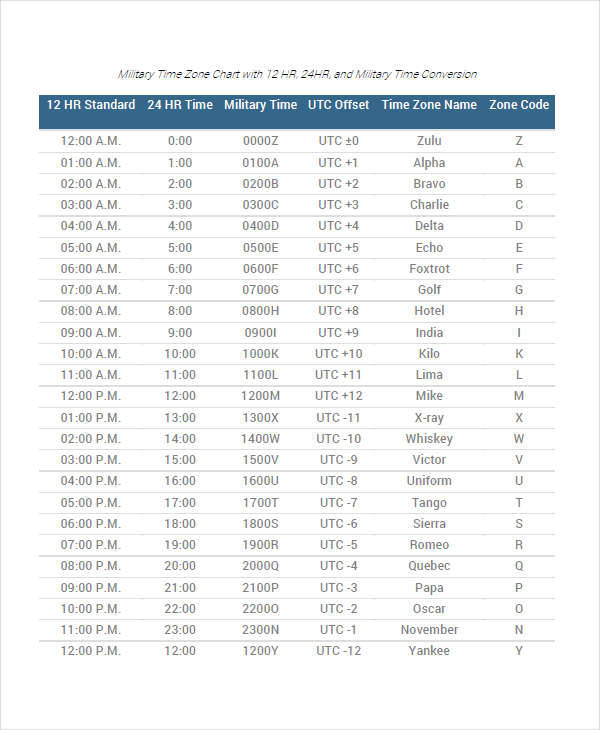
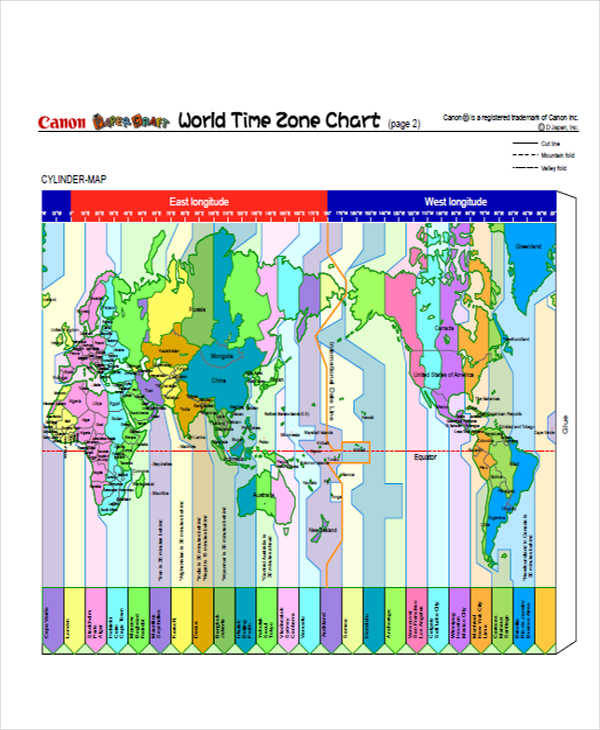
Military Time Zone Chart
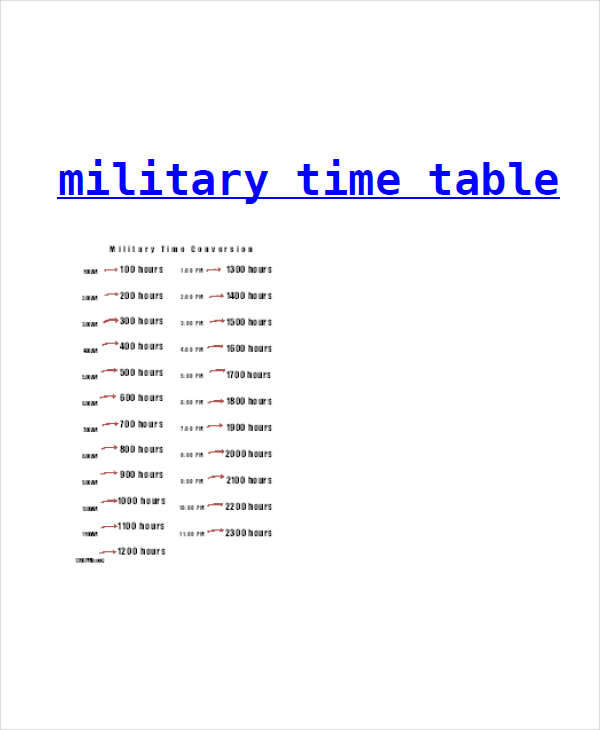
Military Time Table Chart
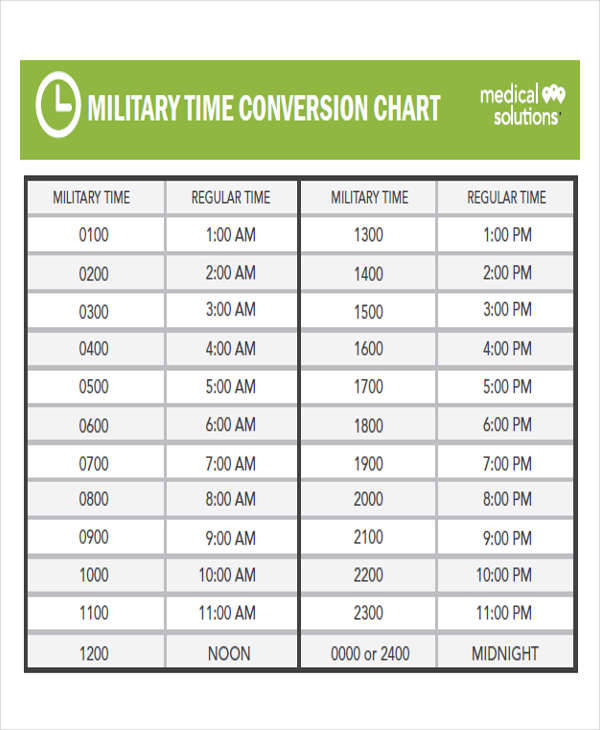
Military Time Conversion Chart
How Do You Tell Time in Military Time?
Now, telling time using military time may seem strange to a civilian, since we were raised and learned only standard time formats for most of our lives. However, take note that this is almost second nature to some people, namely:
- Law enforcement
- Military
- National Guard
- Coast Guard
- Basically any government-funded group that has the sole purpose of protecting the country.
As for telling the exact time using military time instead of the standard time, it is simple; either you use a Free Time Chart that is available on this very site, which would help you convert the time, or you can follow a few basic steps military personnel use to be familiar with the military time format quickly. These steps are:
- List down all the hours in a day.
- Arrange them from morning to afternoon.
- On a separate table, copy all of the digits in the morning portion.
- Note: Only the numerals should be copied.
- Note 12:00 AM is converted into 0000 or 2400.
- Then for the afternoon portion, you start to add 100 for every additional time after 1200.
- For example, it is 01:00 p.m., so instead of writing it like 0100 you would write it like this 1300.
- Then repeat the same steps till you reach 2400.
- Then just review them casually over and over and you will be able to easily convert the time formats.
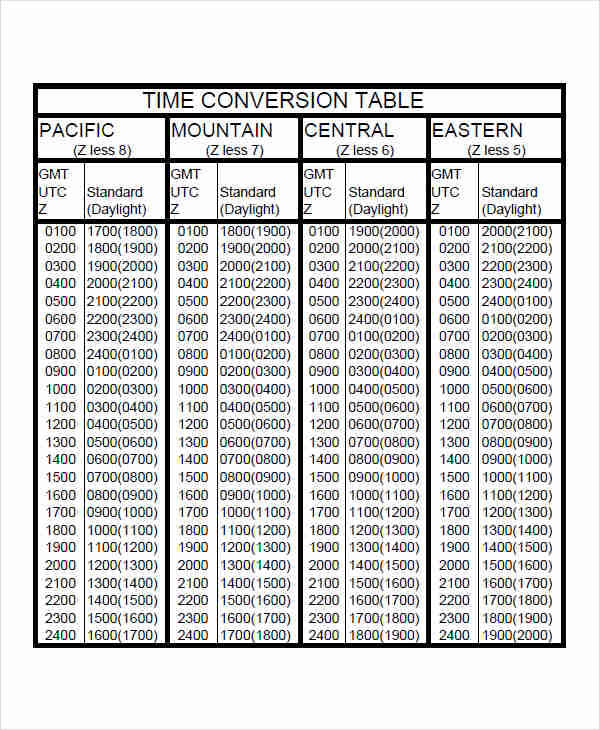
Time Conversion Chart Samples
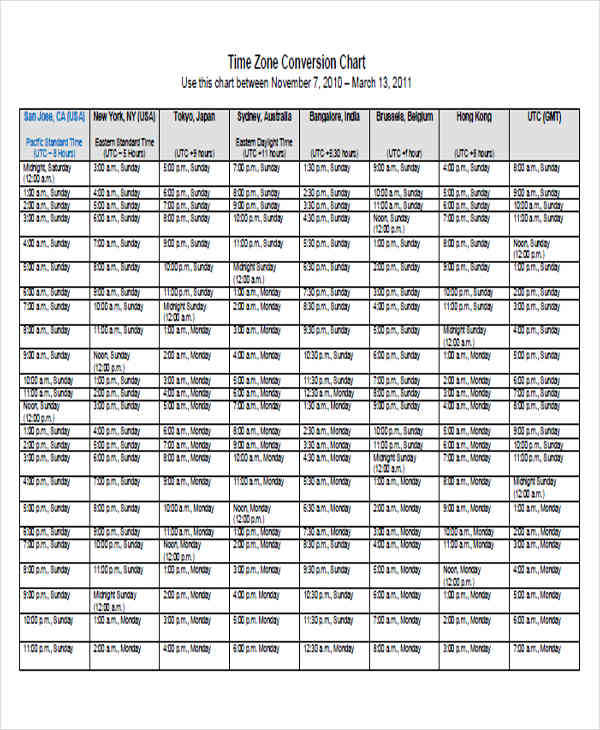
Time Zone Conversion Chart
Time Conversion Table Chart
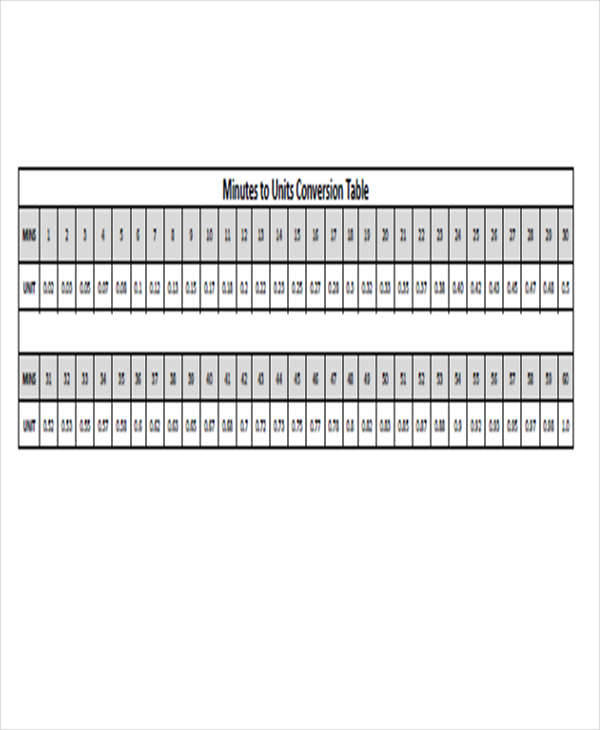
Time Unit Conversion Chart
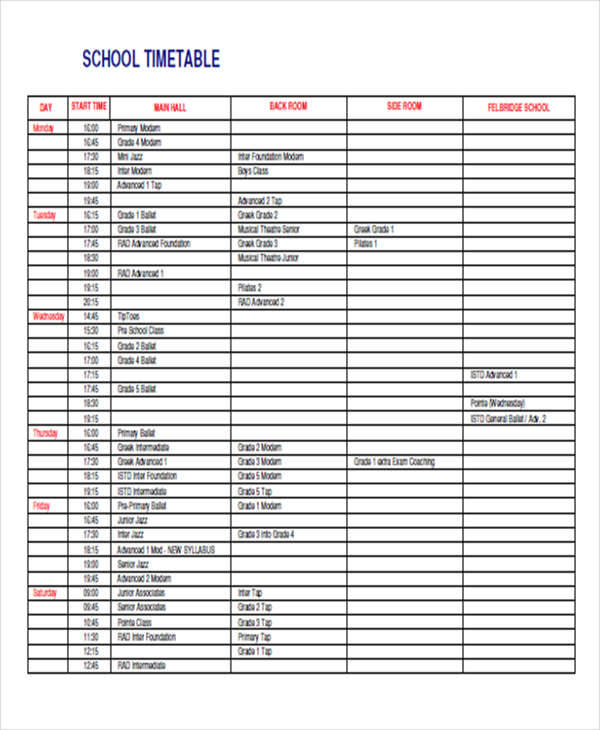
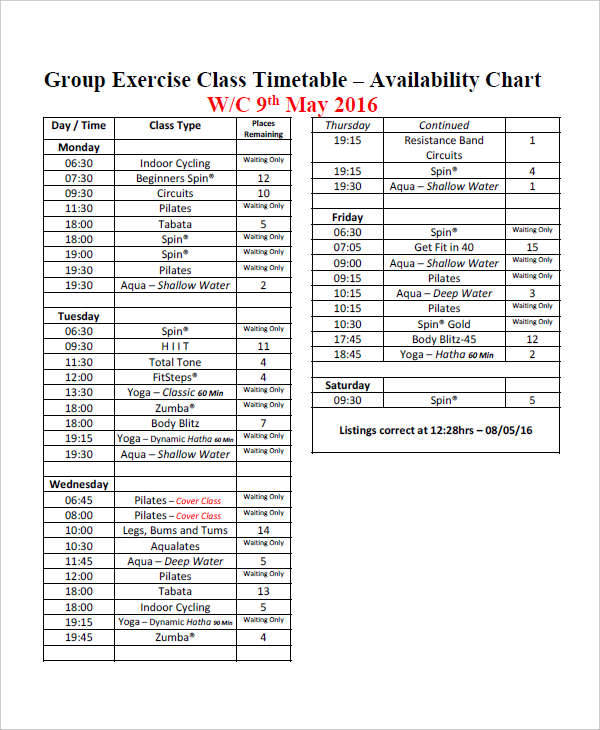
Time Table Charts
School Time Table Chart
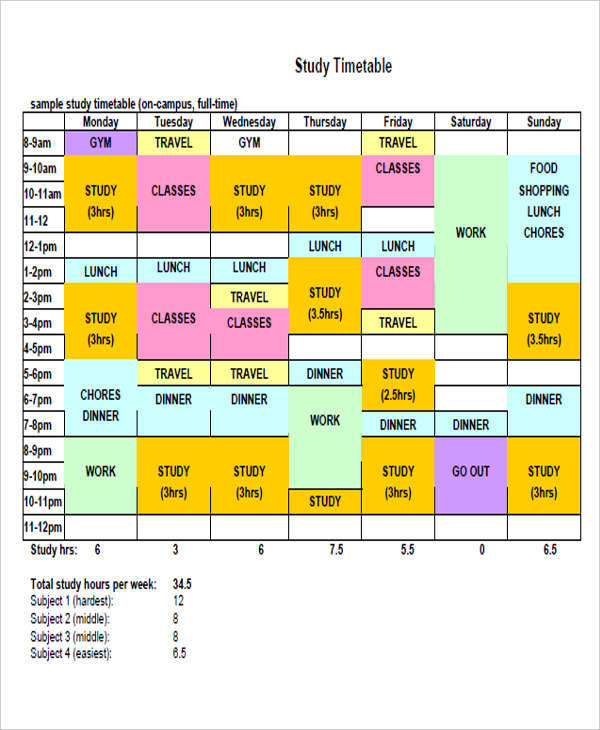
Time Table for Study
Class Time Table Chart
What Is a Time Chart and Why Is It Important?
A time chart is a type of chart that involves keeping track of what standard or military time format are being used in an area. It helps keep track of all the different formats by acting as a form of Time Conversion Chart. It is, however, more commonly used within a “company” (company has a double meaning: definition of company here is used to define a business organization and a military group). Now, you are asking how a time chart is important. It is the same as asking what are the uses of a time chart. Let us begin listing down some of its uses, shall we? To start off, a time chart is important because:
- It helps keep track of time
- It can monitor the amount of time it takes to produce a certain product.
- Or how long a work day will last
- It allows for the unified and faster comprehension of time
- It allows others to perceive time as a standard and fair system of attendance.
- People will be able to notice the time of day more easily.
- It helps manage your time
- Let us say you have a project with a deadline, a time chart will help you set goals and objectives on how you will make the project and what the estimated time of completion would be, providing that you allow extra time for quality assurance and proper time distribution.
- It gives you a chart of how much time you used to create a project and allow you to manage your time so as to be more efficient.
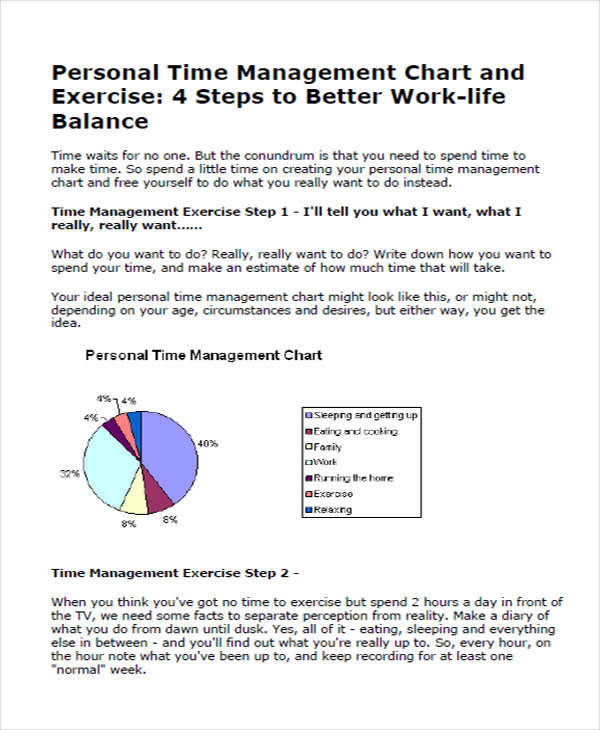
Time Management Chart Samples
Project Time Management Chart
Personal Time Management Chart
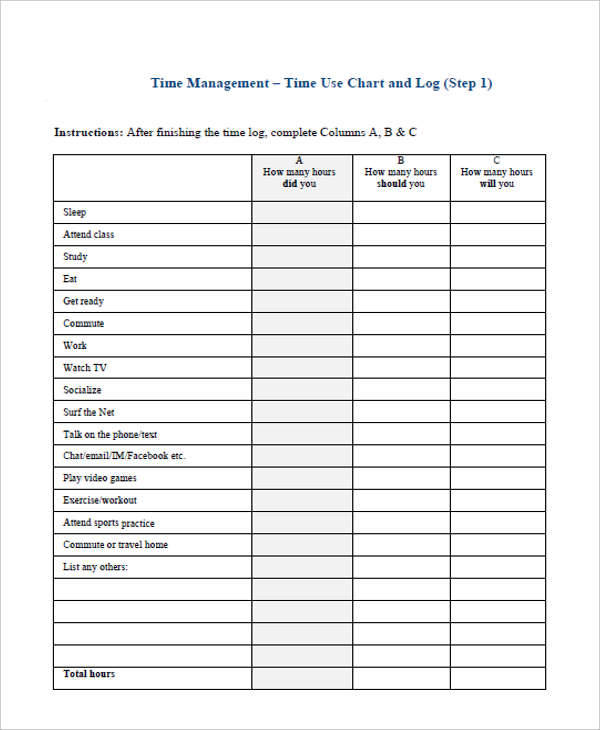
Student Time Management Chart
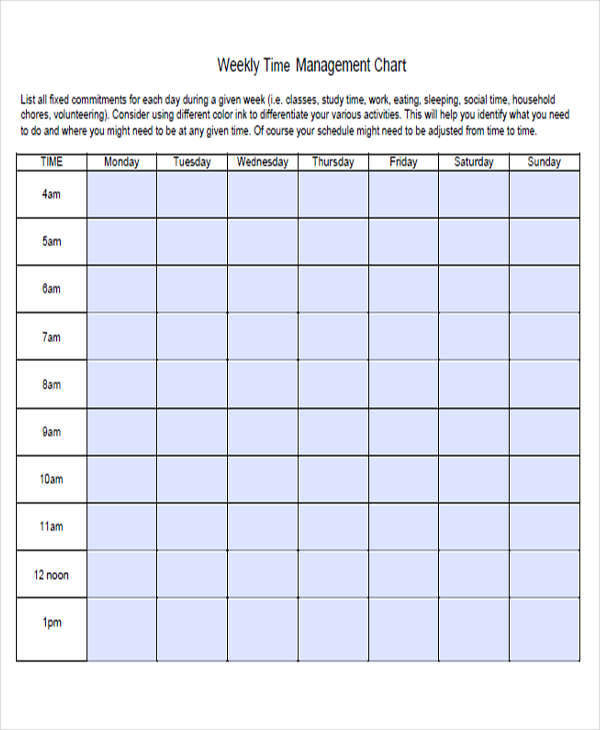
Weekly Time Management Chart
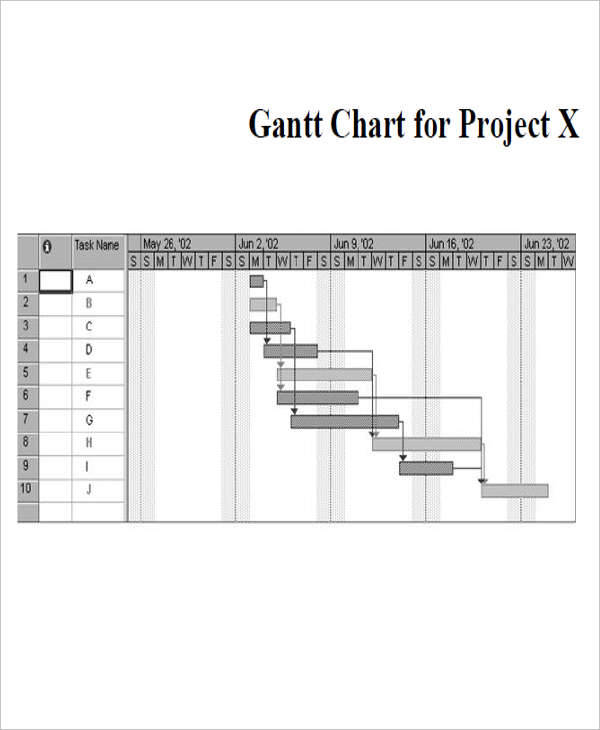
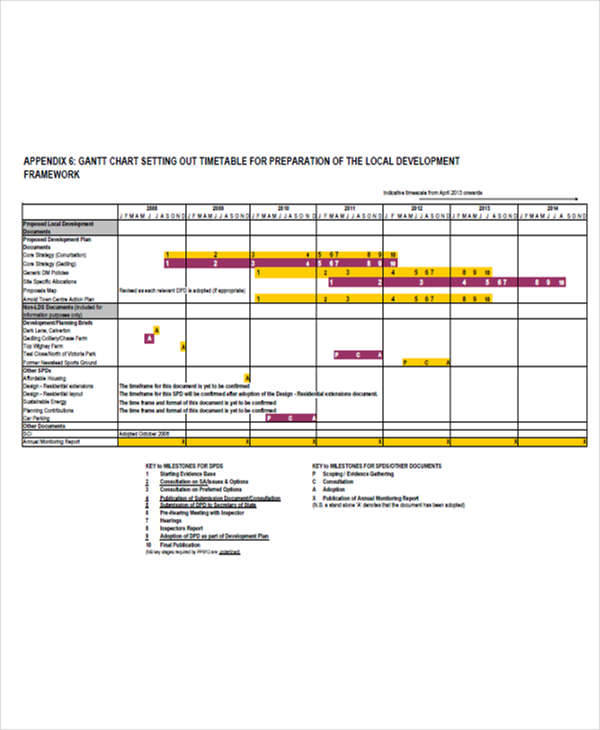
Time Gantt Charts
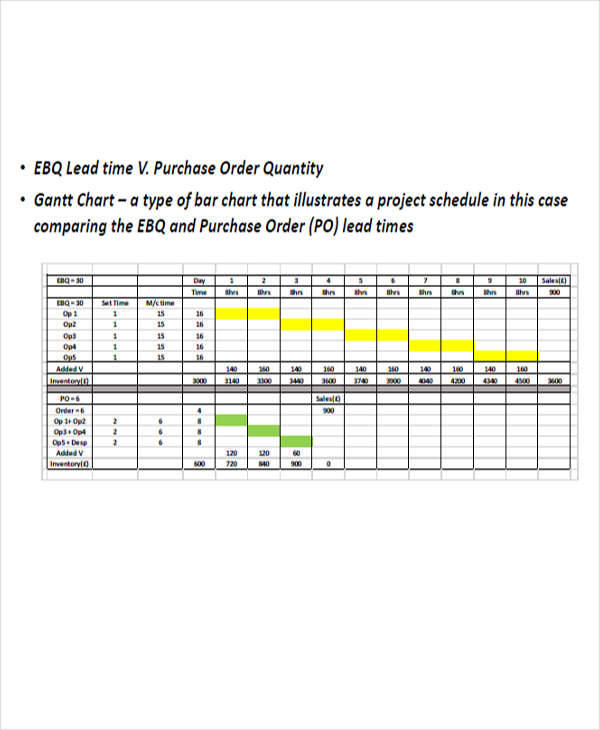
Lead Time Gantt Chart
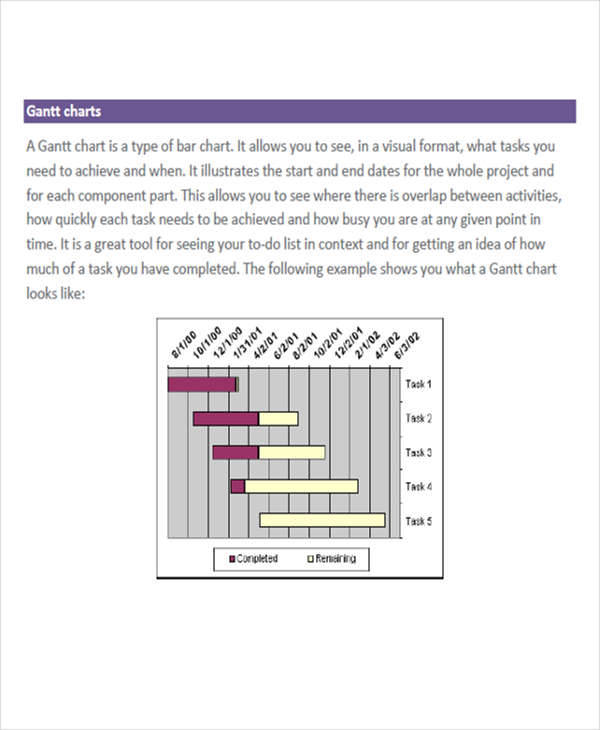
Time Management Gantt Chart
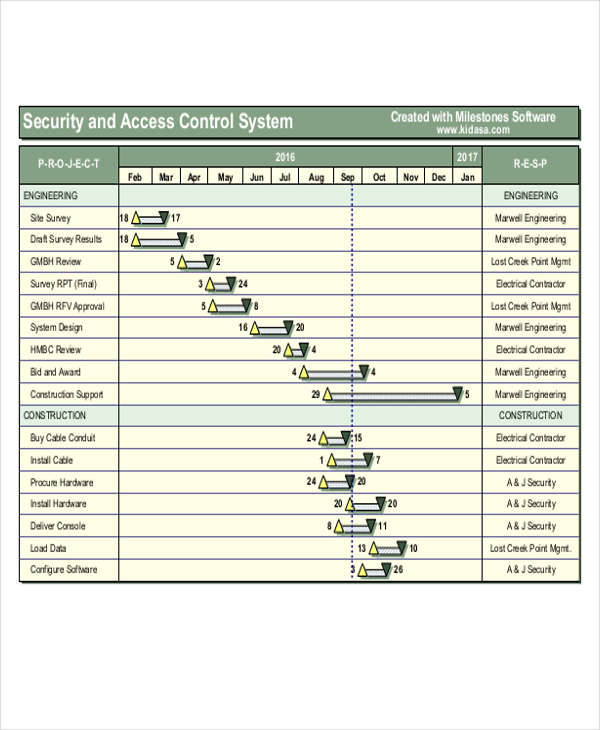
Time Schedule Gantt Chart
Time Frame Gantt Chart
Time Schedule Charts
Weekly Time Schedule Chart
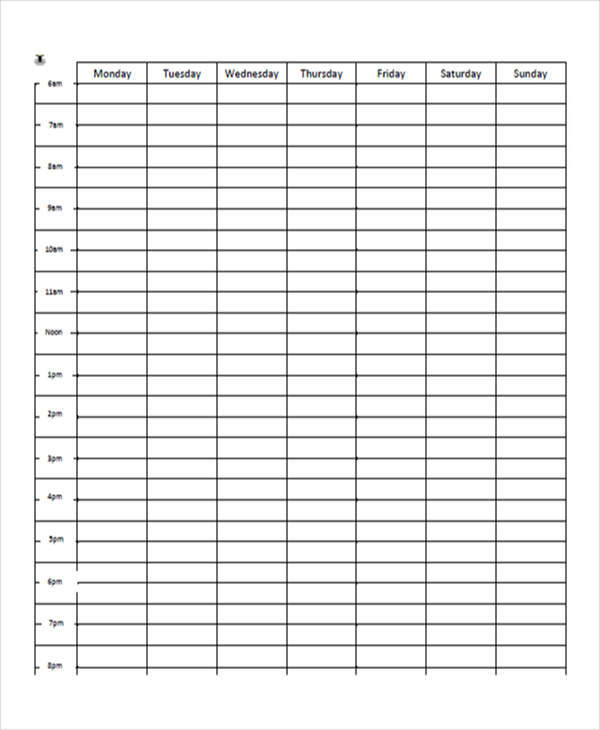
Project Time Schedule Chart
Time Flow Charts
Project Time Flow Chart
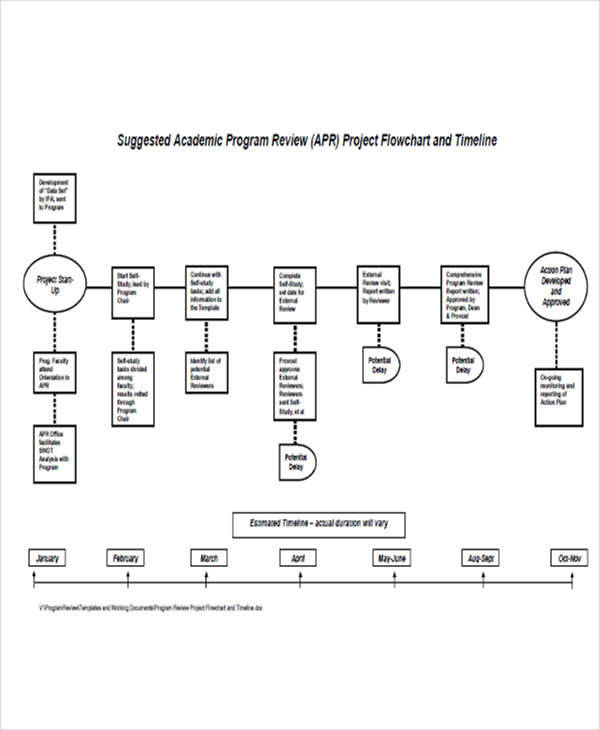
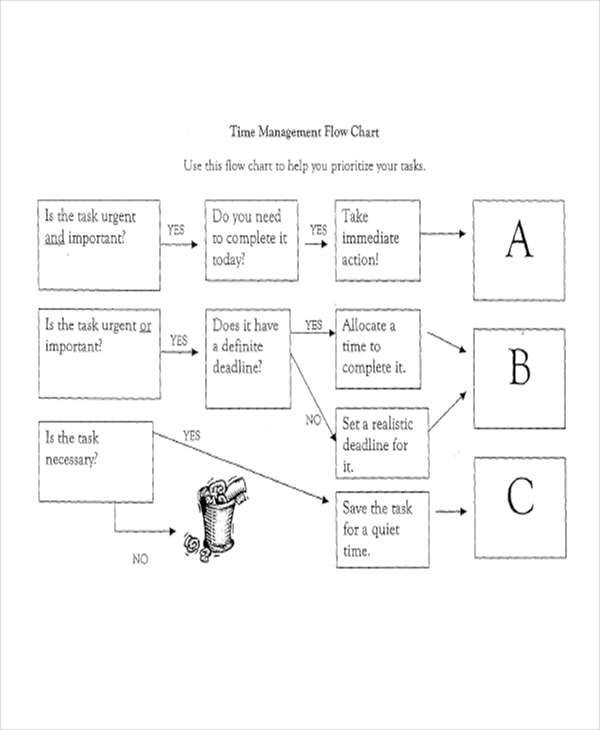
Time Management Flow Chart
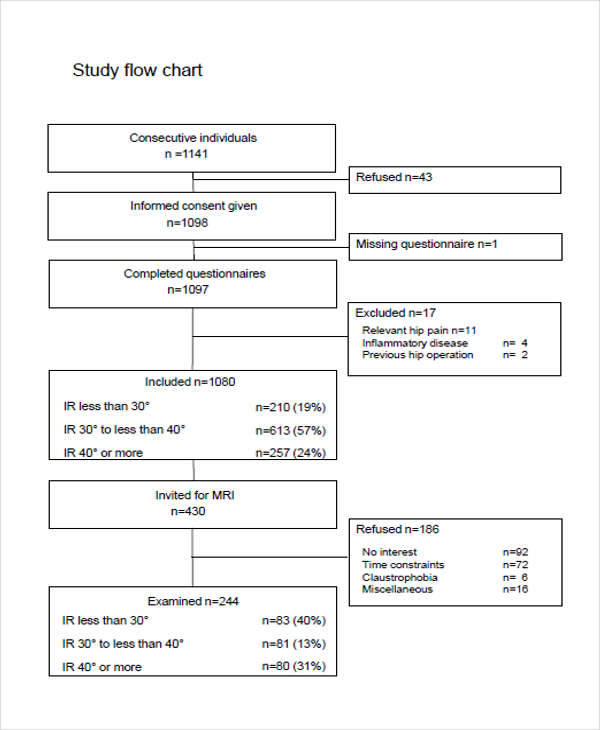
Time Study Flow Chart
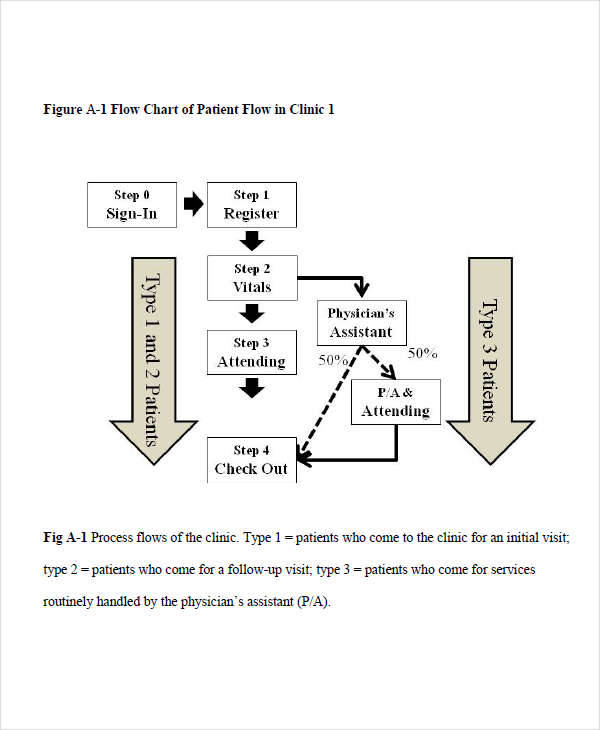
Patient Time Flow Chart
What Is a Time Series Chart?
A time series chart is a type of chart mainly used in the business world. It is an effective tool in writing down and analyzing a company’s performance (be it production of goods, increase in the number of clients, the task accomplished, etc.) during a certain time period. In which a manager or employer level position can determine the current performance rating of a company due to each figure in the time series. Now in order to properly catalog all of the events that are happening within the company, a logging system would be needed so as to keep track of the time, as well as a method of Time Conversion, which will allow the ones analyzing the data easier means of data collection and analysis.
Most companies use this kind of time management chart for its clarity and overall accuracy of a company’s performance during a specified time. However, this type of time chart is not without faults. Similar to any form that requires computation and data input if the data inputted is misinterpreted or is not analyzed properly, it will produce a completely different output based on the data that was given to the person or persons in charge of analyzing the data.
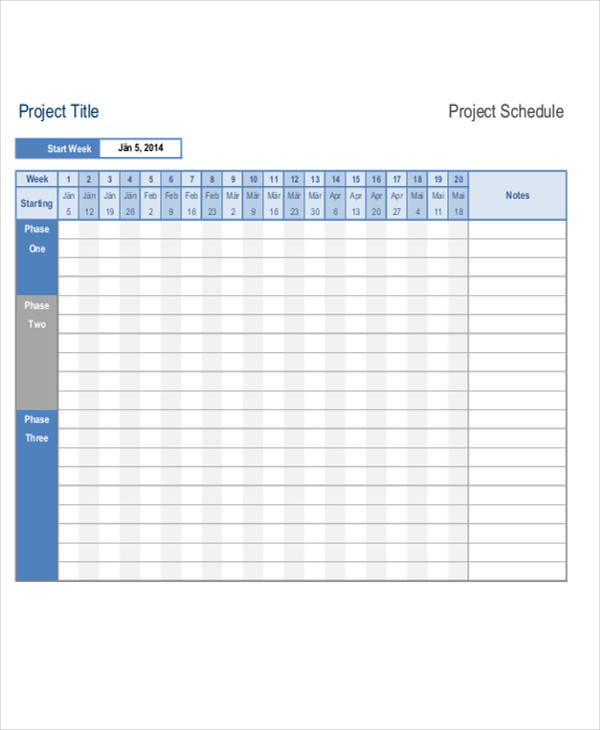
Project Time Chart Samples
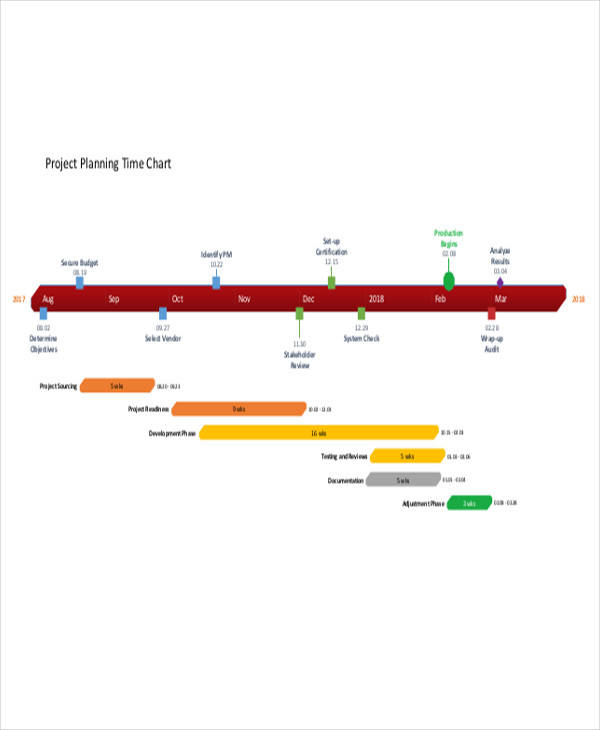
Project Planning Time
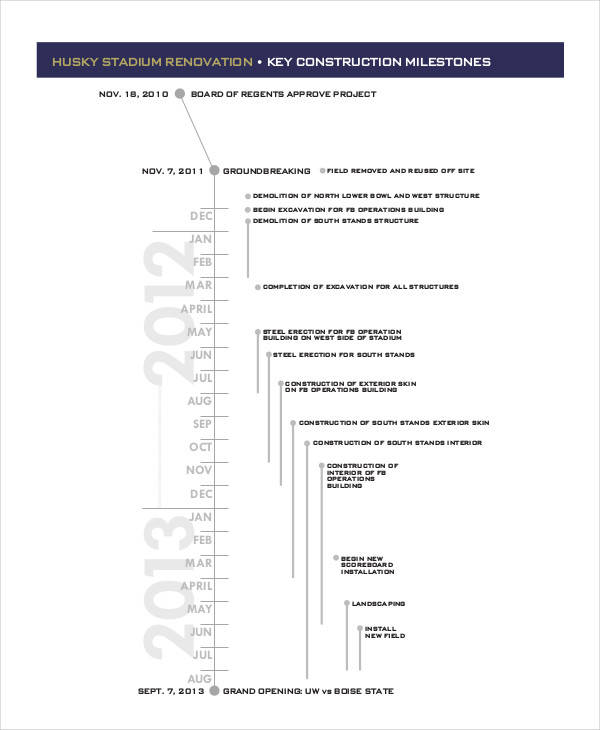
Construction Project Chart
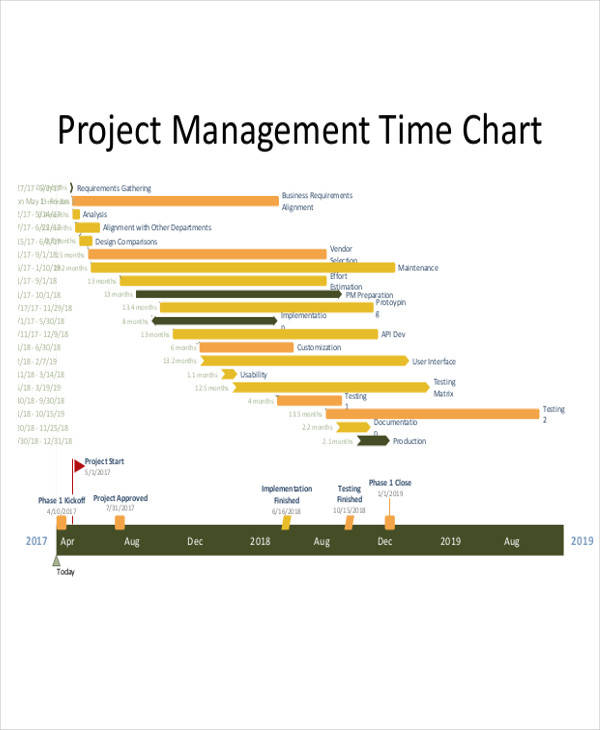
Project Management Time
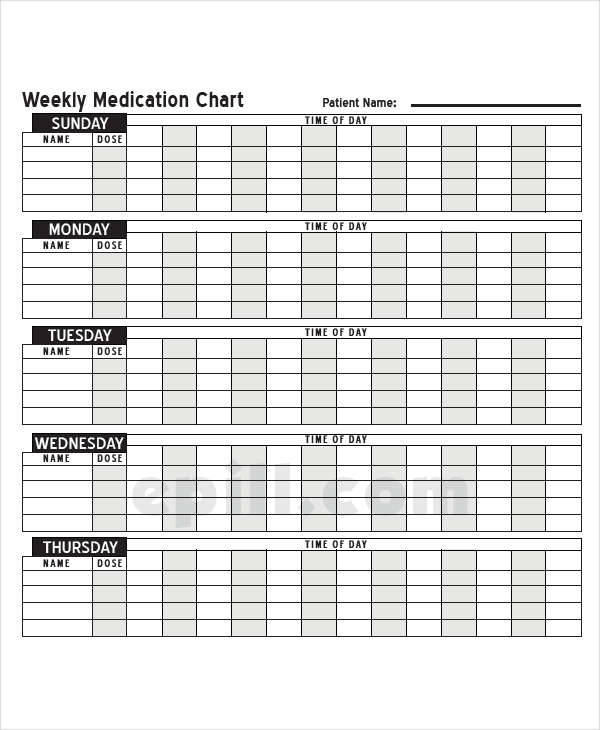
Medication Time Chart
Weekly Medication
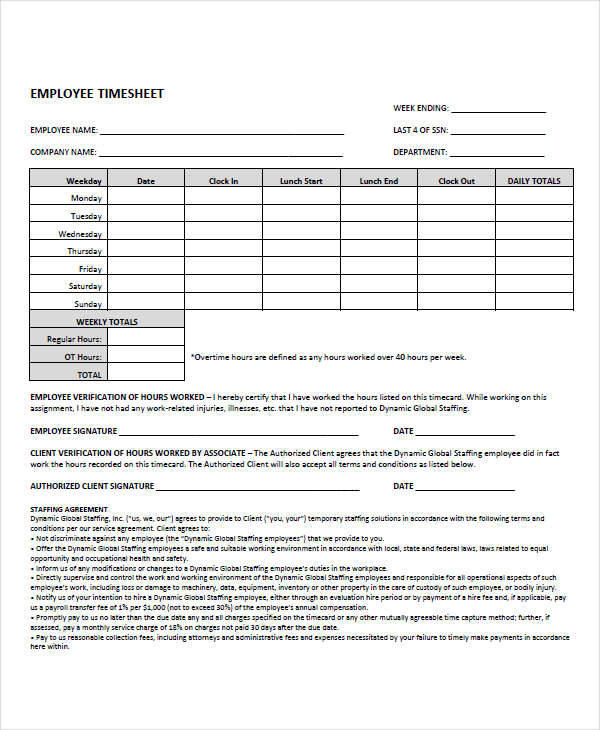
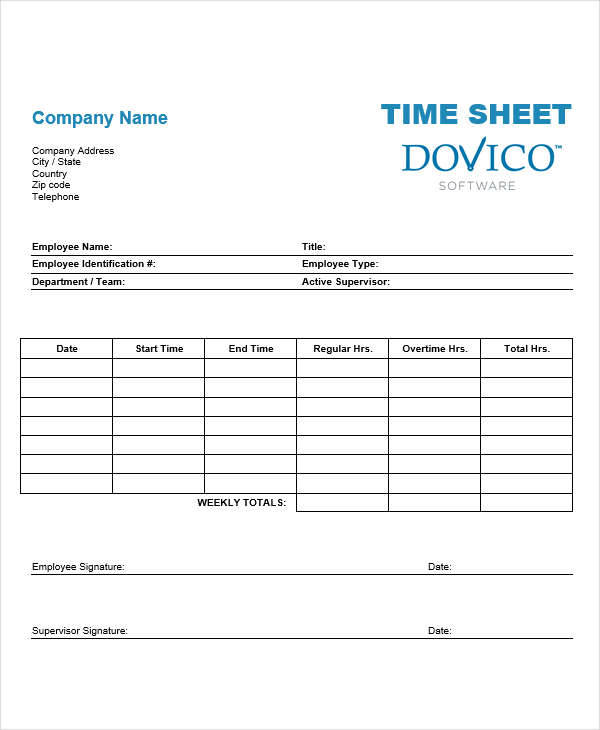
Free Employee Time
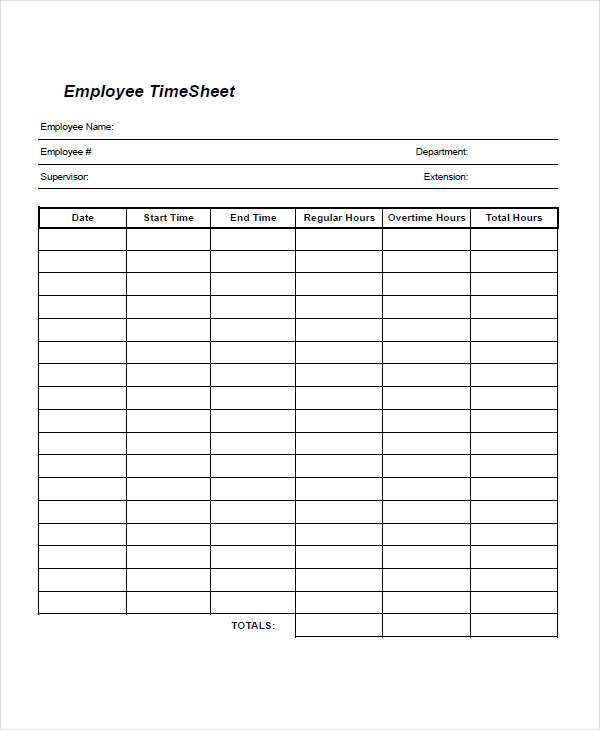
Employee Time Chart
Employee Time Sample
Time Zone Charts
Time Zone Comparison Chart
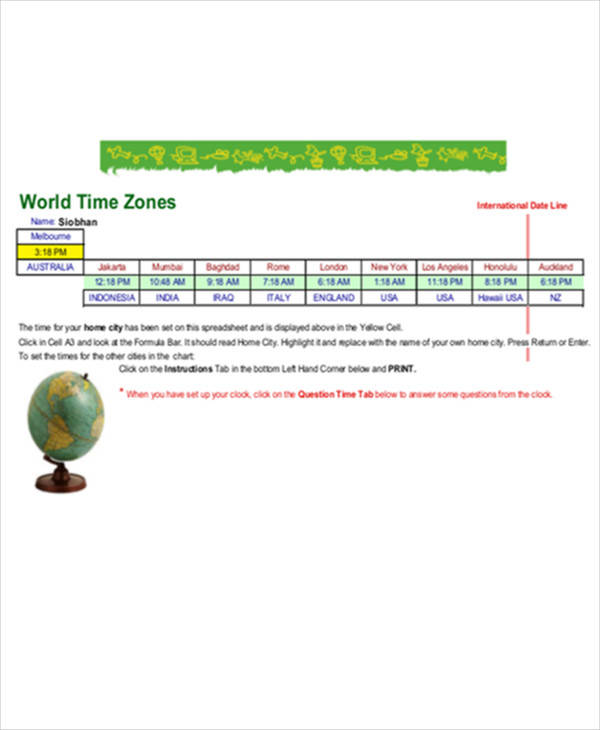
Time Zone Charts Sample
Employee Time Management Chart
Tips for Creating a Time Chart
Since you have read through the entire article and are still reading this portion, it can be concluded that you want to know how to make your own time chart. Well, lucky for you there are many ready-made Time Table Samples here on this site. However, if you really are curious as to how to make your own time chart, then here are some helpful tips when creating your own:
- Keep It Simple
- A simple chart would allow for a more easily understood time chart.
- Be Active in Collecting Data
- Don’t just wing it when you’re collecting data, be as thorough and active as you can be.
- The more data you collect, the more accurate the outcome of the analysis.
- List Down All of Your Data
- List it down and simplify the data in a way it is easy to interpret.
- Create a Table
- Create the table in which you will input your data.
- It is essentially the “screen” of which you will show your output.
Related Posts
FREE 10+ Seat Chart Samples in PDF
FREE 10+ Pie Chart Samples in PDF
Free 3+ Eye Color Chart Samples in PDF
FREE 10+ Family Chore Chart Samples in PDF
FREE 10+ Classroom Chart Samples in PDF
FREE 10+ Genealogy Chart Samples in PDF
FREE 10+ Shipping Chart Samples in PDF
FREE 10+ Goal Chart Samples in PDF
FREE 10+ Character Chart Samples in PDF
FREE 10+ Table Seating Chart Samples in PDF
FREE 10+ Classroom Seating Chart Samples in PDF
FREE 10+ Grade Chart Samples in PDF
FREE 10+ Workflow Chart Samples in PDF
FREE 10+ Budget Chart Samples in PDF
FREE 10+ Process Flow Chart Samples in PDF