
At any age, the old passage rings true: health is wealth. Recent studies additionally suggest that it is exceedingly important for women to stay fit and healthy. In years 2005 to 2014, it has been recorded that women were twice more likely to become obese than men—this according to a United States health awareness project titled “The State of Obesity.”
In health care facilities, schools, and workplaces, posting up healthy weight charts like these BMI Index Chart Templates and the ones compiled below is a good way to remind everyone to take care of their health. Healthy bodies mean more productivity, whatever our work may be, as well as a general disposition against illnesses and health concerns.
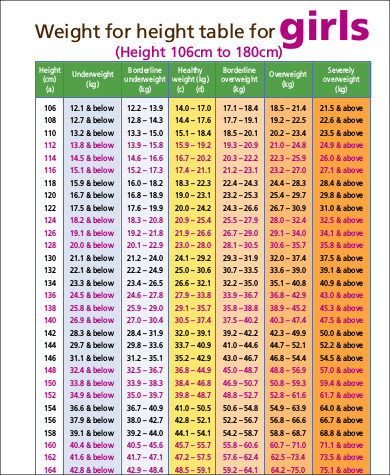
Healthy Weight and Height Chart for Women
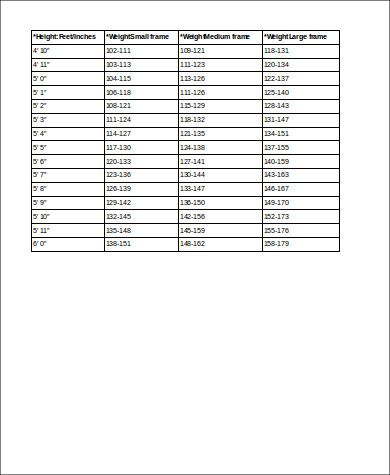
Healthy Body Weight Chart for Women
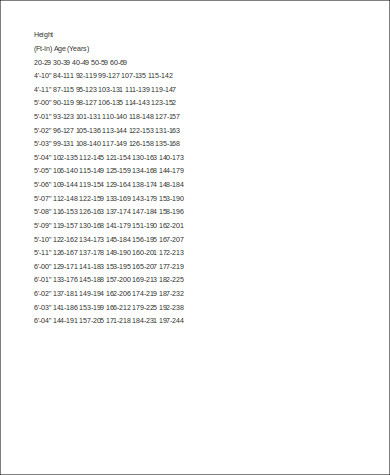
Healthy Weight Chart for Women by Age
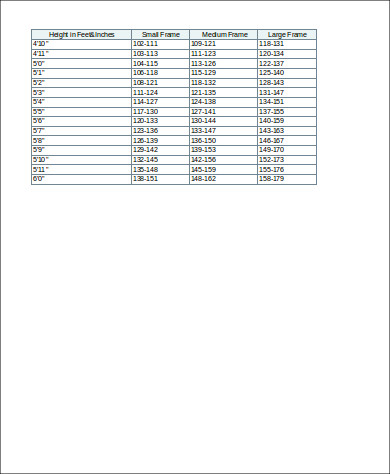
Healthy Weight Range Chart for Women
Fat Distribution in Women
Basically, weight is distributed differently among the sexes. Women store 5 to 10% more body fat than men and distribute it differently too. Women tend to develop fat in the lower abdomen, hips, buttocks, and thighs, whereas men build up more fat in their upper area. This is most apparent at the abdominal region—hence, the pot bellies and beer bellies. That said, fat is better managed by women’s bodies, and we do in fact burn more fat than men.
Body Mass Index
One of the measures for health is the BMI or the Body Mass Index. Our BMI determines whether we are at a healthy weight for our height, whether it is
- healthy/ideal,
- underweight, or
- overweight.
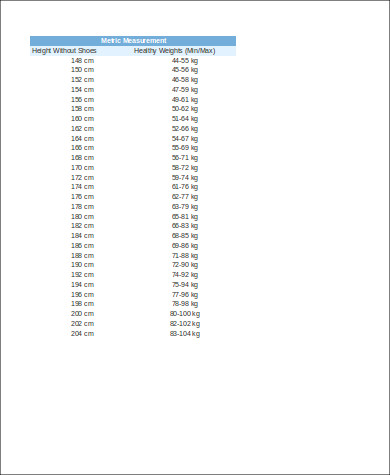
The BMI is the standard used for these healthy weight charts. It commonly uses the metric or the standard systems of measurement. For easy reference, see these Sample Weight Conversion Charts.
A calculated BMI corresponds to a percentile score that may belong to the following categories.
- 19 and below – Underweight
- 20 to 24 – Healthy/Ideal
- 25 to 29 – Overweight
- 30 to 29 – Obese
Since weight is stored and distributed differently among women and men, BMI charts may vary for both.
Healthy Eating
Having a healthy weight has more to do with our daily intake than with daily exercise. However, the two must always be observed. A healthy diet follows this main formula:
+ fruits, vegetables, whole grains, and lean meat;
– dairy, sugars, cholesterol, salt, and saturated fat.
Specifically, the following types of food have been identified by One Green Planet, a healthy and green living organizational platform, to help keep your weight healthy:
- lemons,
- kale,
- almonds,
- blueberries,
- broccoli,
- oats, and
- avocados.
Healthy Weight Charts for Women in PDF
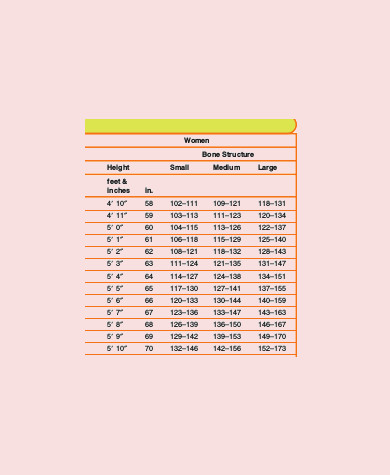
Height and Weight Chart Bone for Women
Studies further recommend that women consume a certain number of calories according to their lifestyles:
- Active – 2,000 to 2,400 calories per day
- Moderately active – 1,800 to 2,200 calories per day
- Sedentary – 1,000 to 1,600 calories per day
You can consult a dietitian or a physician about the number of calories that you should consume according to your body, your daily needs, and your everyday activities.
Joining the army also requires a different set of height and weight requirements. For reference, see these Sample Army Height and Weight Charts.
Related Posts
FREE 10+ Seat Chart Samples in PDF
FREE 10+ Pie Chart Samples in PDF
Free 3+ Eye Color Chart Samples in PDF
FREE 10+ Family Chore Chart Samples in PDF
FREE 10+ Classroom Chart Samples in PDF
FREE 10+ Genealogy Chart Samples in PDF
FREE 10+ Shipping Chart Samples in PDF
FREE 10+ Goal Chart Samples in PDF
FREE 10+ Character Chart Samples in PDF
FREE 10+ Table Seating Chart Samples in PDF
FREE 10+ Classroom Seating Chart Samples in PDF
FREE 10+ Grade Chart Samples in PDF
FREE 10+ Workflow Chart Samples in PDF
FREE 10+ Budget Chart Samples in PDF
FREE 10+ Process Flow Chart Samples in PDF