
A measurement chart is a list of measurements that have a variety of functions, from sewing clothes, cooking meals, and even body measurements. These charts are used as a guide on what to measure so as to collect data relevant to the reason you are collecting those measurements. Writing a chart about measurements is quite simple; it is basically a table with a specific format.
Sometimes measurement charts are composed of other charts as well. When displaying the output data, the most commonly used charts would be either a bar graph or a pie chart. This is because of the simplicity of the design of the chart.
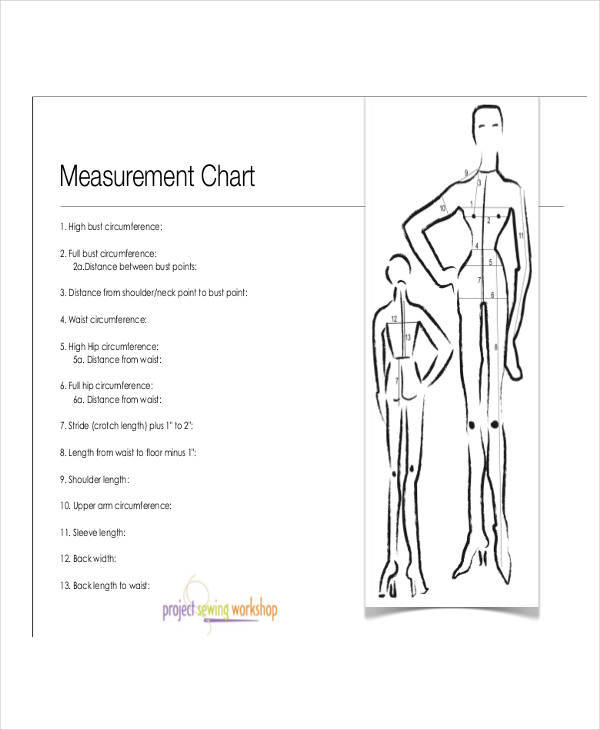
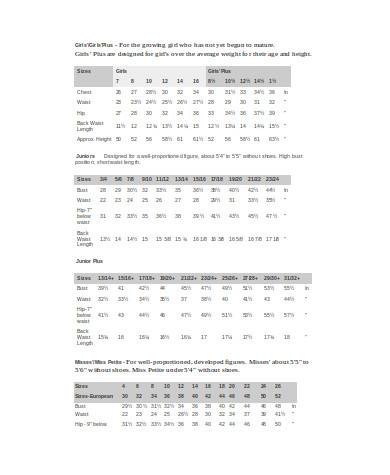
Body Measurement Chart
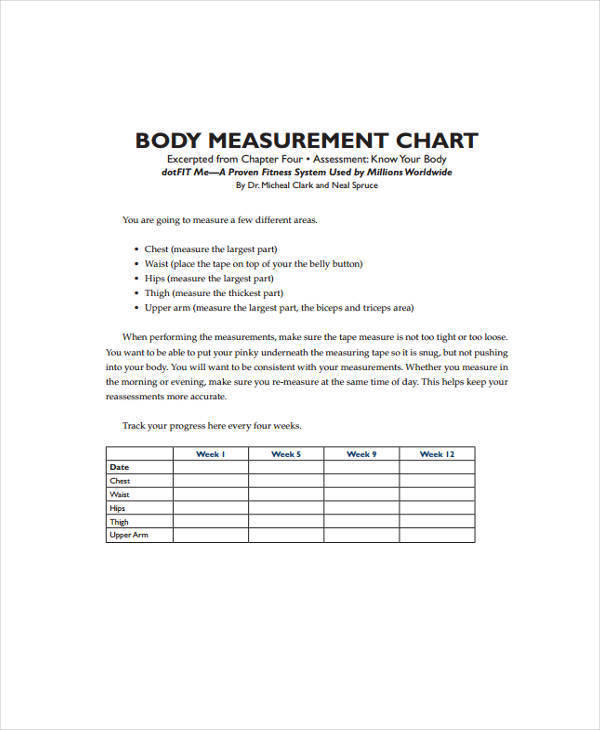
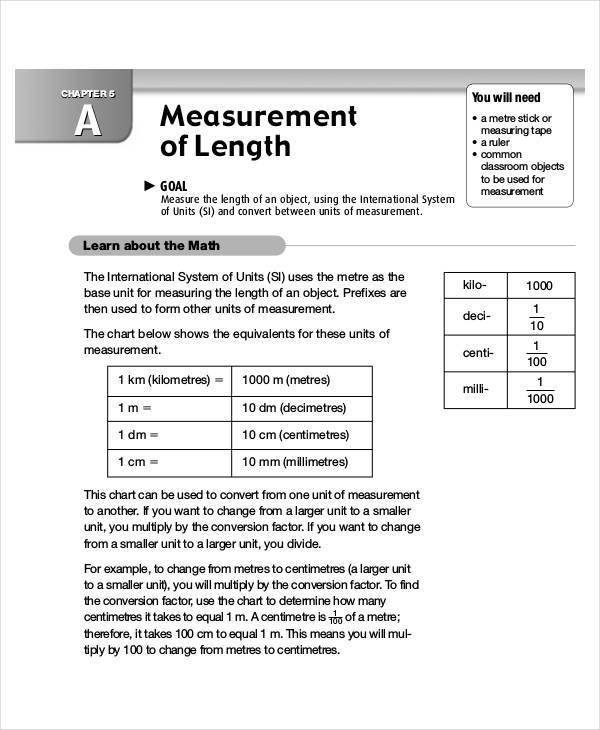
Chart for Metric Measurement
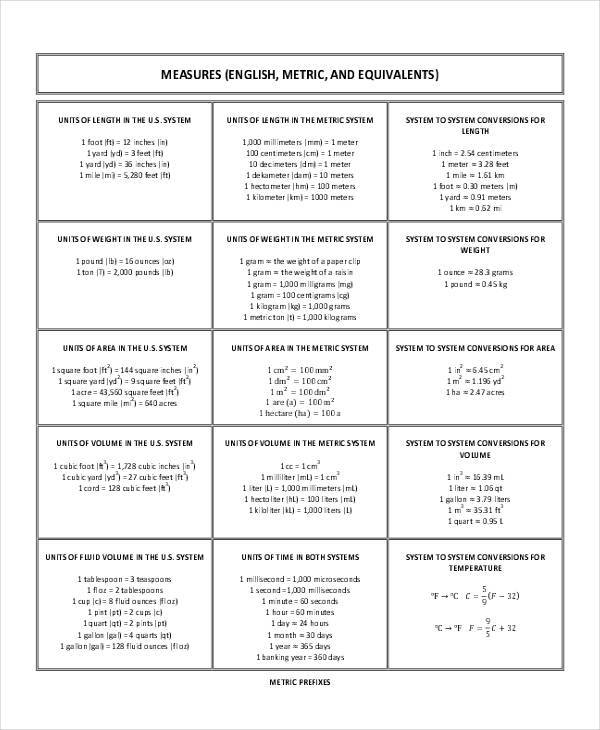
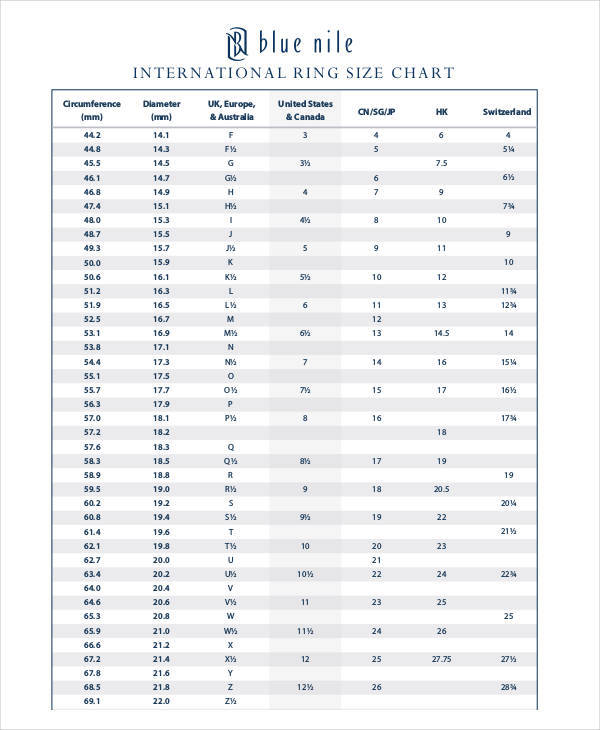
Chart for Ring Measurement
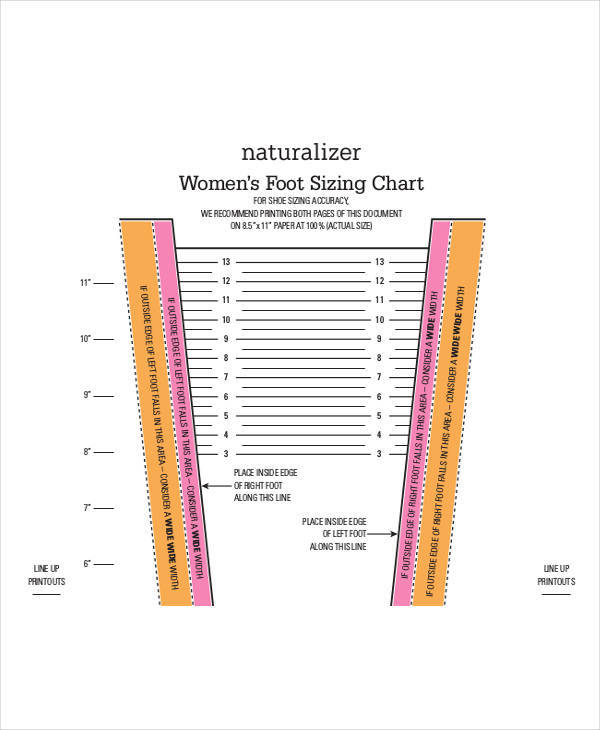
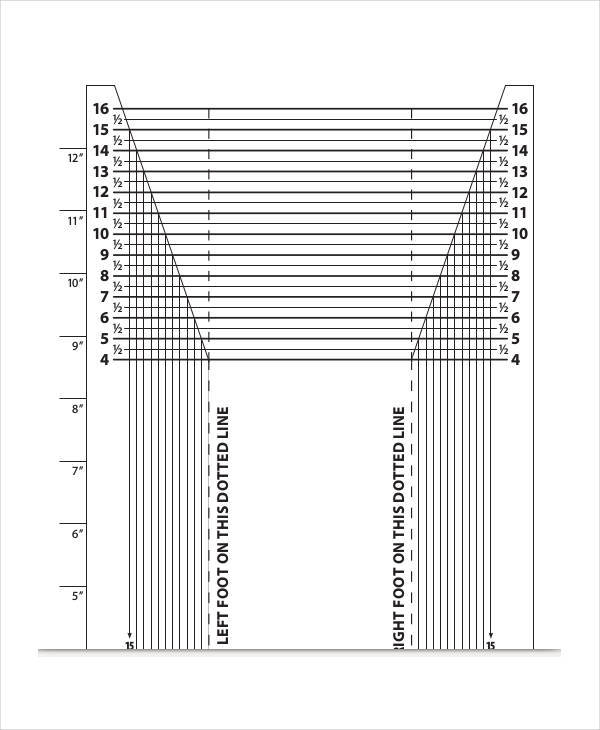
Foot Measurement Chart
Shoe Measurement Chart
How to Make a Measure and Size Chart
- Like any document, start with the title of the document. In this case, the title should be labeled “Measure and Size Charts.”
- Below the title of the chart, indicate the purpose of the chart you are making.
- Depending on the chart you are making, design either a large table for measuring a single object (e.g., foot measurement charts) or a table with several boxes to indicate smaller measurements but in larger quantities (e.g., liquid measurement chart).
- When making the tables, remember to indicate the measurements of each box.
Measurement charts are just like time conversion charts; aside from both being made in the same chart format, they are also oftentimes used as an easier method of calculating a certain value.
What Are the Uses of a Measurement Chart?
A measurement chart is a means or a way to easily convert numerical values of certain measurements to more manageable and simple formats that are typically used to suggest or match a person’s measurement with a certain product. Aside from conversion purposes, it can also be used to identify the size of materials you might need for your projects.
These printable charts for measurements are commonly used in places that sell clothes, shoes, or even building materials. The application of measurement charts is a great way to save time compared to having the customer try out each product to find a perfect match.
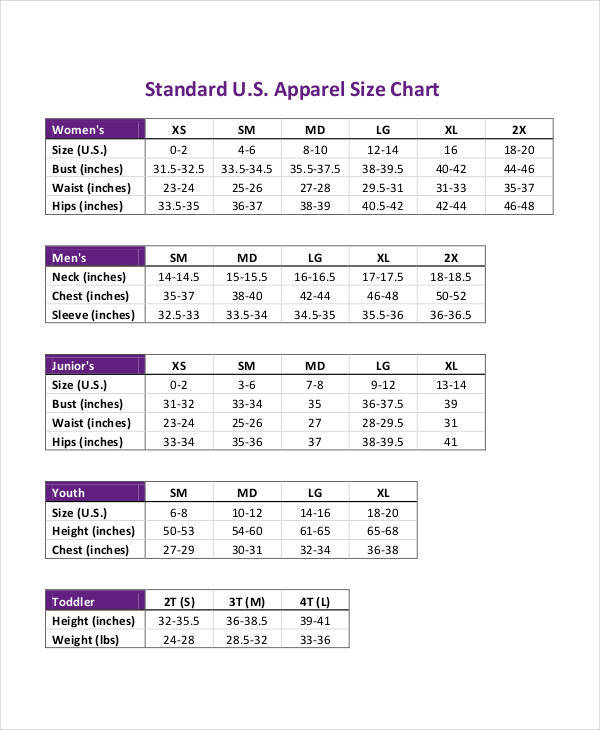
Clothing Measurement Chart
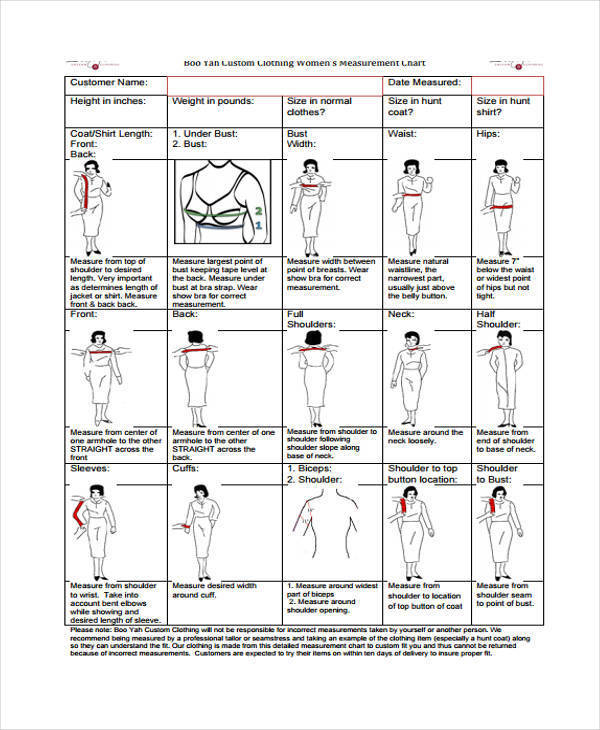
Chart for Height Measurement
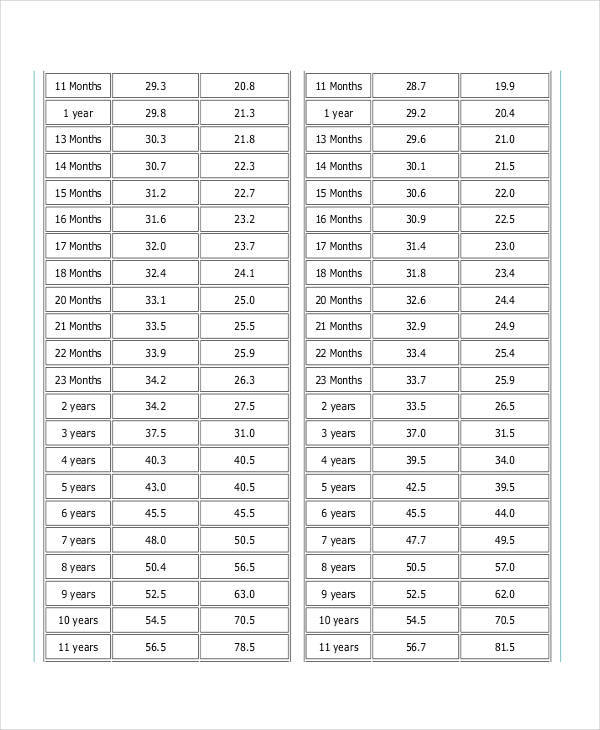
Chart for Waist Measurement
Measurement Conversion Chart

Length Measurement Chart
Standard Measurement Chart
Measurement Chart Sample
Guidelines for Making Measurement Charts
The best way to make a measurement chart would be to use free charts of measurements.
- Determine what kind of measurement chart you want to use.
- Depending on the type of chart you are using, research the complete measurements for it.
- Always scale things to model, meaning, have a standard measurement ready as a comparison.
- When you’re done making the chart, test how accurate it is.
What Is a Metric Conversion Chart?
A metric conversion chart is a list of all the metric units (measurement of length, weight, and volume) and is usually listed in an order to easily convert measurements without the need of a calculator or other devices. This saves time and is a much cheaper alternative to using other conversion tools around.
Time charts are similar to a metric conversion chart in the sense that a time chart can be used as a method of converting time into another time format. We have printable time charts available should you need to use one.
Related Posts
FREE 10+ Seat Chart Samples in PDF
FREE 10+ Pie Chart Samples in PDF
Free 3+ Eye Color Chart Samples in PDF
FREE 10+ Family Chore Chart Samples in PDF
FREE 10+ Classroom Chart Samples in PDF
FREE 10+ Genealogy Chart Samples in PDF
FREE 10+ Shipping Chart Samples in PDF
FREE 10+ Goal Chart Samples in PDF
FREE 10+ Character Chart Samples in PDF
FREE 10+ Table Seating Chart Samples in PDF
FREE 10+ Classroom Seating Chart Samples in PDF
FREE 10+ Grade Chart Samples in PDF
FREE 10+ Workflow Chart Samples in PDF
FREE 10+ Budget Chart Samples in PDF
FREE 10+ Process Flow Chart Samples in PDF