
This style of graphic organizer is most commonly used for comparison. Because it shows a clear division for the objects or subjects, the layout is perfect for comparison. When it pertains to using the graph for comparison, the storyboard style offers for a lot of flexibility, including the option to assess more than two items by adding extra cells. We often need to comprehend all opposing arguments when studying historical events and politics. The T-Chart is an excellent tool for displaying two or more people’s or groups’ ideas or conditions.
10+ T-Chart Samples
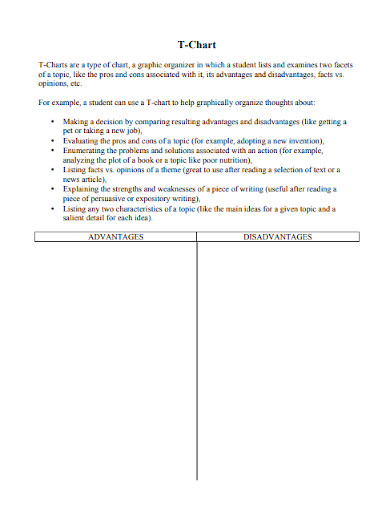
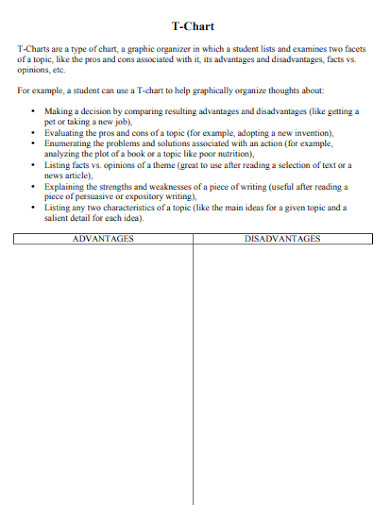
T-Chart is a graphic organizer that looks at two sides of a topic, such as the benefits and drawbacks, advantages and downsides, facts vs. opinions, and so on. It’s simple to compare the two solutions by putting the themes as column headings and jotting down many facets that apply to both. It can take the shape of a list of positive and bad features associated with a specific choice, ensuring that both the positive and negative aspects of any route or conclusion are considered. Once you’ve completed the overview, you’ll find that you’re in a position to solve your problem. And this is critical for making a final selection.
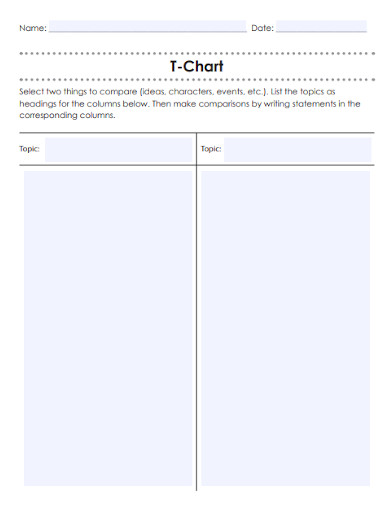
1. T-Chart Template
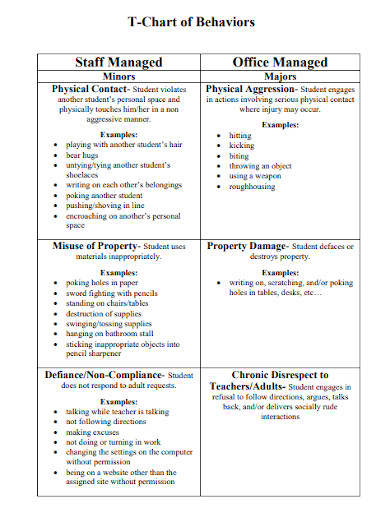
2. T-Chart of Behaviors
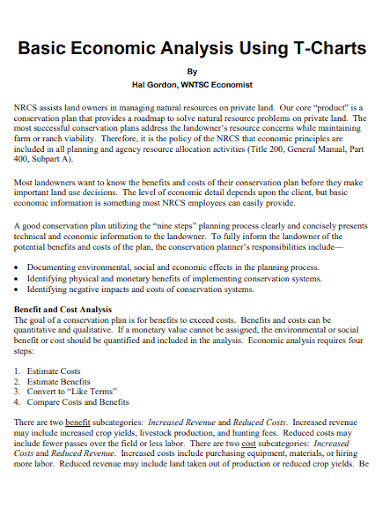
3. Economic Analysis Using T-Chart
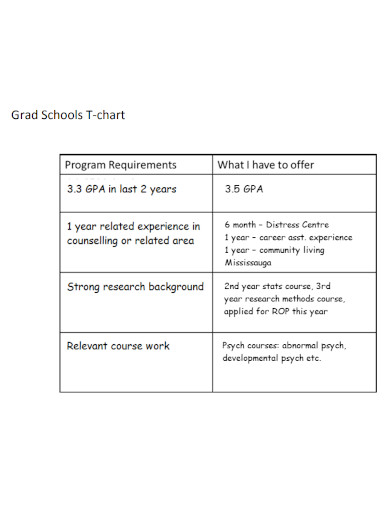
4. Grad Schools T-Chart
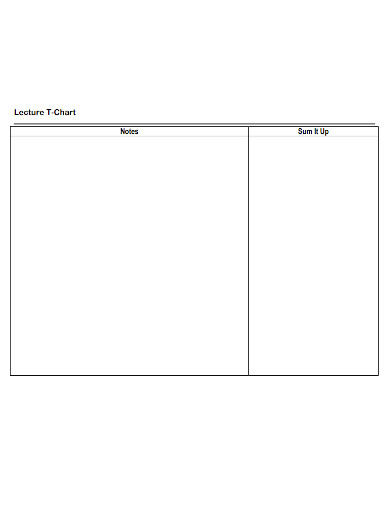
5. Lecture T-Chart
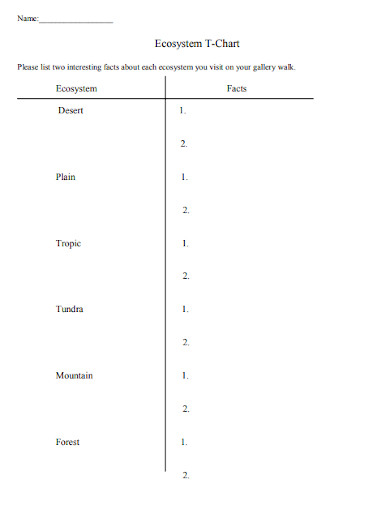
6. Ecosystem T-Chart
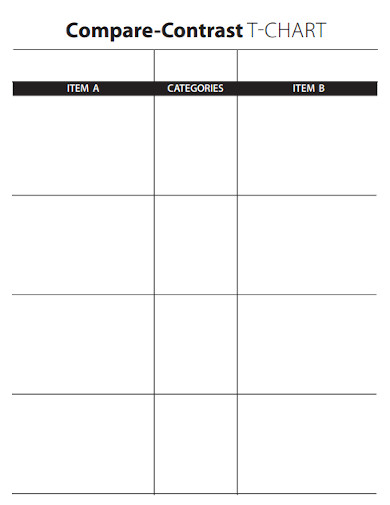
7. Compare-Contrast T-Chart
8. Standard T-Chart
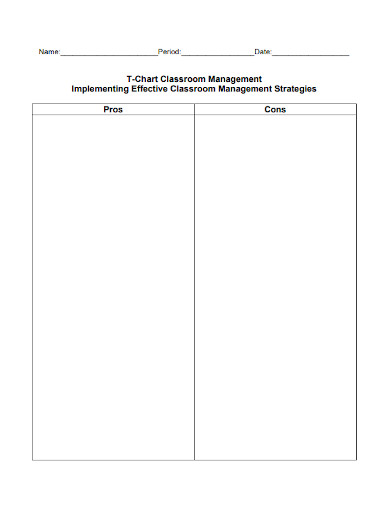
9. T-Chart Classroom Management
10. Student T-Chart
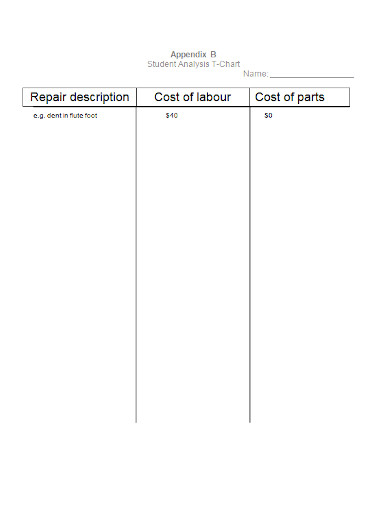
11. Student Analysis T-Chart
The T-chart is a useful graphical method that allows pupils to compare and contrast topics visually. In any academic discipline or genre, T-charts can be employed for books or fictional characters, science occurrences, or social studies activities. You can also do the following with the help of these:
- Sort the information into groups.
- Examine and debate the distinctions between two or more objects.
- Demonstrate a shift in your behavior.
The simple layout of a T-chart makes it ideal for use in a variety of school activities. Making students utilize T-charts to make critical class decisions is a good idea. For example, students may choose to select a place for a class field trip. As a class (or in small groups), have students list one of two options at the top of each column, then discuss the benefits and drawbacks of each option. The class will compare the data and make the best conclusion feasible once these have been recognized.
Students might also compare and contrast the positions of two political candidates or list the advantages and disadvantages of a group converting to geothermal energy. Using a T-chart to get students to apply their ideas in a class discussion or a persuasive essay can be effective and simple to understand. Furthermore, students can use their imagination to identify the two sides of a narrative, event, or object by doing so.
You now know that a T-chart can accurately identify each component of a problem. It also includes sufficient and adequate descriptions to clarify each aspect of a scenario. Since of its simplicity, a T-chart is frequently used in educational settings because it makes it easier to assimilate information. There are a variety of other common uses for a T-chart organizer.
FAQs
What are sample situations where you can use T-chart for exemplary representation?
- Advantages and drawbacks
- Scenarios before and after
- Causes and effects
- Scenarios before and after
- Both back then and now
- Advantages and disadvantages
- Problems and their solutions
- Facts vs. opinions
- Strengths and weaknesses
- Whether correct or erroneous,
What are some of the tips in making the best T-chart?
- Produce clear and logical writing that is appropriate in terms of production, structure, and style for the project, intent, and audience.
- Investigate how and why characters, incidents, and concepts in a text evolve and communicate.
- Avoid using a lot of animations, colors, or features.
A T-chart separates data into columns and compares data in a useful way. Its adaptable design is useful and frequently utilized in a variety of conversations. Take advantage of the existing templates or develop your own with only a few clicks.
Related Posts
FREE 14+ Sample Music Concert Proposal Templates in MS Word | Google Docs | Pages | PDF
FREE 10+ Security Guard Contract Samples in PDF | MS Word
FREE 10+ Assurance Agreement Samples In MS Word | Google Docs | Apple Pages | PDF
FREE 10+ Option to Purchase Agreement Samples in MS Word | Apple Pages | PDF
FREE 26+ Curriculum Form Samples in MS Word | PDF
FREE 20+ Cleaning Service Proposal Samples in PDF | MS Word
FREE 29+ Sample Loan Application Form Templates in MS Word | PDF
FREE 10+ Event Venue Contract Samples in PDF | MS Word | Pages | Google Docs
FREE 10+ SBAR Samples in PDF | DOC
FREE 12+ Music Band Contract Templates in PDF | MS Word
FREE 10+ HVAC Maintenance Contract Samples in PDF | MS Word
FREE 10+ Social Media Marketing Contract Samples in MS Word | PDF
FREE 10+ Wholesale Assignment Contract Samples in PDF
FREE 18+ Financial Proposal Samples in PDF | MS Word | Google Docs | Pages
FREE 10+ Feasibility Study Samples in PDF