
Whether you’re an engineering student, event planner, or restaurant manager, it can be a daunting task if you’re tackling a large project. Fortunately, you can find various tools and materials to help you organize any project. Just a few examples of such resources are mind maps, column charts, attendance sheets, workflow diagrams, and feedback reports. When it comes to scheduling and organizing different tasks in a project, that’s where you’ll need to incorporate a PERT chart. A PERT chart typically consists of text bubbles interconnected by lines or arrows that outline how tasks relate with or transition into each other. If you need to design a PERT chart of your own, consider downloading one of the downloadable sample templates below.
5+ Pert Chart Samples in PDF
1. Pert Chart Analysis
2. Developing Gantt and PERT Chart
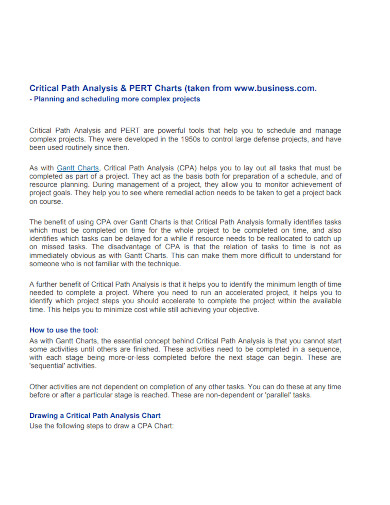
3. Critical Analysis and PERT Charts
4. Project Planning PERT Charts
5. Making a PERT Chart

6. Student Pert Testing and Placement Chart
What Is a PERT chart?
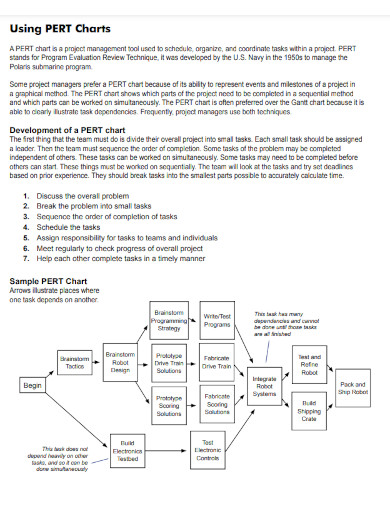
Effective management and organization are integral to success when taking on a project of considerable scope. From students to entrepreneurs, any project manager should implement the right tools for the right job. Spreadsheets, dashboards, reports, and surveys are a few examples of such resources. Program evaluation and review technique charts (PERT charts) are fitting for coordinating each timeline and activity within a project. A PERT chart works by outlining the relevant project data with lines, arrows, and text bubbles. You can incorporate PERT charts for education, business, and personal life. Putting together such a diagram is easy enough to do by yourself; however, you still need to dedicate a fair amount of time to the process. And so, to help you streamline your chart, we’ve prepared several guide steps for your reference.
How to Make a PERT Chart
1. Prepare Your PERT Chart with a Proper Application
Creating a PERT chart requires a certain degree of time and attention. First, you need to pick a preferred program that lets you put together a diagram or spreadsheet. You can choose from a variety of software to make a PERT chart. For instance, Windows users can create PERT charts using MS Word or MS Excel. On Mac computers, Apple Pages and Apple Numbers are ideal for preparing PERT charts. And Google Docs allows you to compose a PERT chart with only an online web browser.
2. Determine How to Implement Data into Your PERT Chart
A PERT chart requires the appropriate information to outline project tasks. Create a summary of steps, timelines, and milestones before arranging them in text bubbles and lines. You have a fair amount of flexibility in setting up your PERT chart’s visuals. For example, lines can represent timeline transitions, while bubbles can represent numbered steps or vice versa. Use your discretion to decide what type of labeling setup serves your project best.
3. Incorporate Comprehensive Visuals into Your PERT Chart
With a PERT chart, you can provide readers (and yourself) with a quick and efficient way to assess a project’s multiple tasks. Apply distinct coloring to make various visual elements stand out from each other, ensuring your diagram’s readability. Additionally, you can communicate varying levels of emphasis by using more than one font style and size.
4. Download a PERT Chart Template for Quicker Preparation
If you can’t afford enough time to make a PERT chart from scratch, consider using a sample template for your convenience. You can find premade chart samples for referential purposes or blank ones you can customize by yourself. And for the most flexibility across different operating systems, download a PDF sample.
FAQs
How are PERT charts and Gantt charts different from each other?
Their differences are in their visuals, with PERT charts using interconnected network diagrams and Gantt charts displaying information through bar graphs.
What are the benefits of using a PERT chart?
Planning complex projects, showing task interdependencies, determining completion deadlines, and anticipating project durations.
What is the disadvantage of using a PERT chart?
The main disadvantage of using a PERT chart is that a project’s size and scope can make it tedious to create.
PERT charts are invaluable for all kinds of projects. Whether you run a manufacturing company, wedding supplier, photography profile, advertising agency, or construction business, incorporating PDF sample templates is always a good idea for saving time.
Related Posts
FREE 8+ Blood Type Chart Samples in PDF | DOC
FREE 10+ Medicine Chart Samples in PDF | MS Word
FREE 10+ Seat Chart Samples in PDF
FREE 10+ Pie Chart Samples in PDF
Free 3+ Eye Color Chart Samples in PDF
FREE 10+ Family Chore Chart Samples in PDF
FREE 10+ Classroom Chart Samples in PDF
FREE 10+ Genealogy Chart Samples in PDF
FREE 10+ Shipping Chart Samples in PDF
FREE 10+ Goal Chart Samples in PDF
FREE 10+ Character Chart Samples in PDF
FREE 10+ Table Seating Chart Samples in PDF
FREE 10+ Classroom Seating Chart Samples in PDF
FREE 10+ Grade Chart Samples in PDF
FREE 10+ Workflow Chart Samples in PDF