
Gantt charts are useful tools for project plan and project schedule, as they provide a visual representation of the project’s timeline outline, showing which task lists are critical and how long they are expected to take. They also allow project managers to monitor progress tracker and identify potential delays or bottlenecks.
10+ Gaant Chart Samples
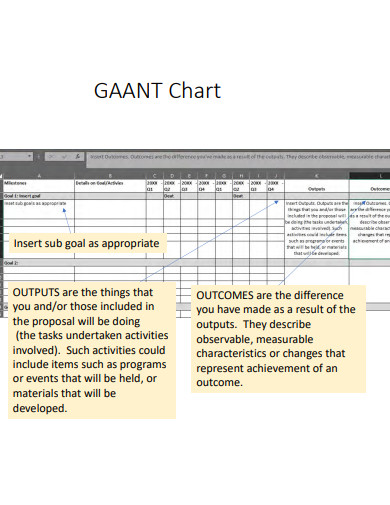
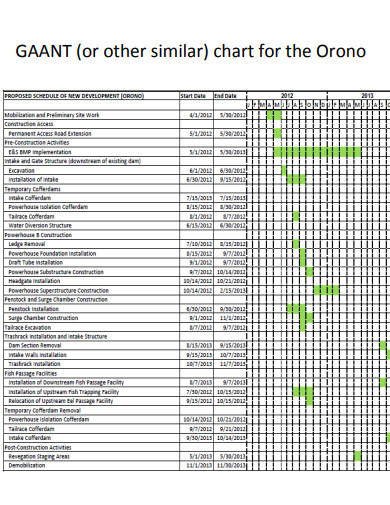
1. Gaant Chart
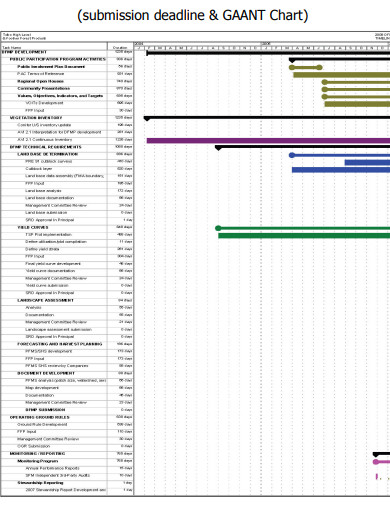
2. Submission Deadline Gaant Chart
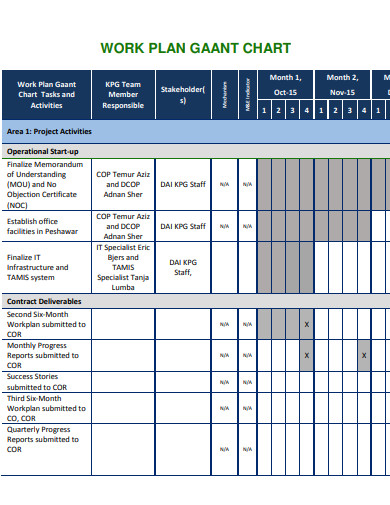
3. Work Plan Gaant Chart
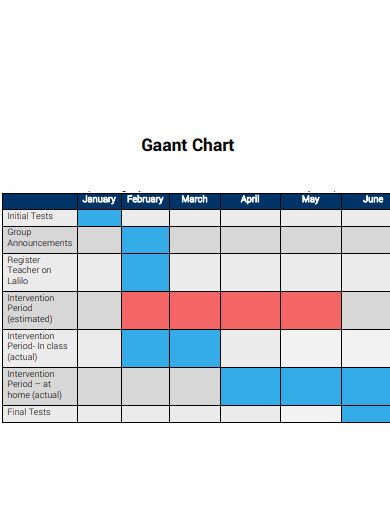
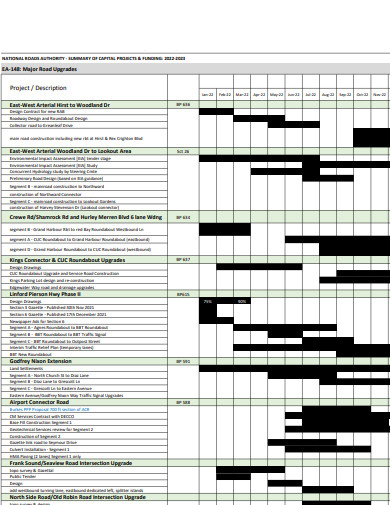
4. Sample Gaant Chart
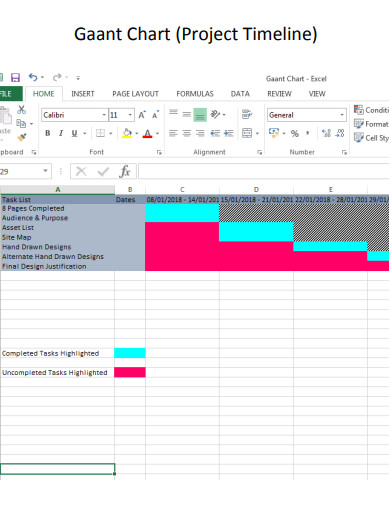
5. Gaant Chart Project
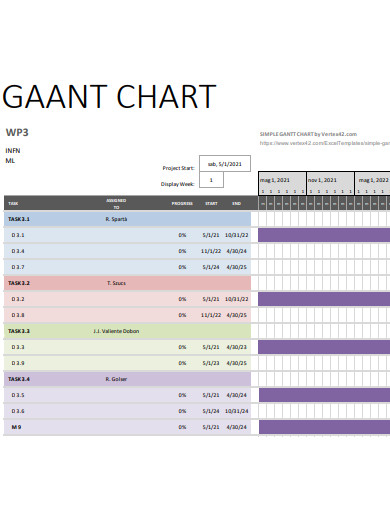
6. Simple Gaant Chart
7. Timeline Gaant Chart
8. Conference Gaant Chart

9. Gaant Chart using Microsoft Excel

10. Gaant Chart Example
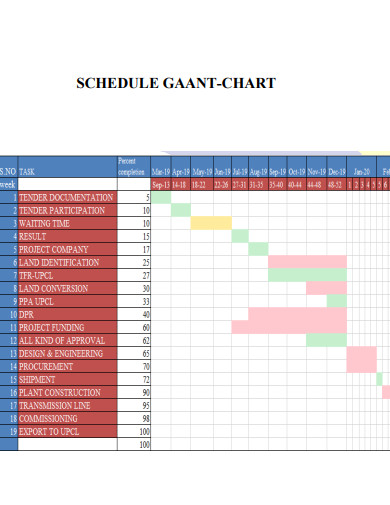
11. Schedule Gaant Chart
What is Gantt Chart?
Typically, Gantt charts use horizontal bars to represent the duration of each task, with each bar positioned along the timeline samples according to its start and end dates. Tasks can be color-coded or labeled to indicate their status, priority, or other attributes. Dependencies between tasks can be shown using arrows or other symbols to indicate which tasks must be completed before others can start.
How To Make Gantt Chart?
Meeting agenda with specific members of the project team to begin defining activities and constructing a timetable chart is a standard first step in the process of creating a schedule. This strategy will provide a schedule, but there is a possibility that it will not be an exhaustive one. When a schedule is complete, it includes all of the activities necessary to meet the requirements of the 100% Rule. The requirement that the project scope baseline include one hundred percent of the project’s scope is known as the 100% Rule.
Step 1- Review Scope
Bring the team together and go over the approved scope baseline, which is made up of three components: 1) the Scope Statement, 2) the Work Breakdown Structure (WBS), and 3) the WBS Dictionary. It is the responsibility of the member of the project team to verify that the scope baseline covers the whole project scope.
Step2 – Create Activities
The project team utilizes a method known as “decomposition” to divide each WBS work item into activities. The team needs to establish standards for the creation of weekly activity schedule, much like they did when they were making the WBS work packages. The most effective and time-saving version of the timetable should be used for the final version. Both having too few and having too many things to do might be problematic. While breaking the project down into its component parts, it is essential to set timelines and establish milestones.
Step 3- Sequence Activities
Every activity is connected to at least one and sometimes several other activities. Every activity, with the exception of the very first and very final, has a relationship with an activity that came before it and an activity that will come after it. Putting things in the appropriate order and making sure you have the right relationships between things is what we mean when we talk about sequencing.
Step 4- Estimate Resources
The identification and evaluation of the available resources are prerequisites to the estimation of the durations. Resources include labor, material and equipment. There are a few different approaches to estimating, the most common of which are analogous, parametric, three-point, and bottom-up. The estimate must take into consideration a number of important elements, including skills, abilities, and technology. After an estimation of the resources has been made, the resources are inserted into the schedule next to the activities that they correspond to. In addition, a resource calendar is made to display both the availability of resources and the times when they are required.
What are the different parts that make up a gantt chart?
It is composed of a to-do list, a timeline, a dateline, milestones, and bars.
How to Work Together More Effectively with Your Group Using Gantt Charts
Right there on the Gantt chart view, you may organize a group call to work on the project plan together with your colleagues. You also have the option of pre-populating the list of tasks in the Gantt, which can be done by either using a simple import tool or by cutting and pasting the list. This will ensure that the tasks and assignments are already populated when your team joins a session.
Excel doesn’t appear to have a Gantt chart, does it?
There is no Gantt chart functionality available in Microsoft Excel. You can make your own by modifying the stacked bar chart or by utilizing one of the free Gantt chart templates that are accessible online. Both of these methods are described further down.
Putting together your own Gantt chart is the most effective approach to become familiar with utilizing one. You can test out your scheduling software by experimenting with a project you’ve created there. Experiment with the various options to see which columns on the project schedule provide the information you need and practice using those columns. If you want to check out a new feature or view before you try it out on a “real” project schedule, your test project file can come in handy for that purpose as well.
Related Posts
FREE 10+ Pie Chart Samples in PDF
Free 3+ Eye Color Chart Samples in PDF
FREE 10+ Family Chore Chart Samples in PDF
FREE 10+ Classroom Chart Samples in PDF
FREE 10+ Genealogy Chart Samples in PDF
FREE 10+ Shipping Chart Samples in PDF
FREE 10+ Goal Chart Samples in PDF
FREE 10+ Character Chart Samples in PDF
FREE 10+ Table Seating Chart Samples in PDF
FREE 10+ Classroom Seating Chart Samples in PDF
FREE 10+ Grade Chart Samples in PDF
FREE 10+ Workflow Chart Samples in PDF
FREE 10+ Budget Chart Samples in PDF
FREE 10+ Process Flow Chart Samples in PDF
FREE 10+ Medication Chart Samples in PDF | DOC