
Whenever a customer buys a product or avails of a services, the revenue is then recorded onto a sales report. Reports such as these are crucial to businesses since it helps them track and record their sales progress and is often required by top management during business meetings. Aside from sales recorded on a daily, or monthly basis a consolidated report is also organized by quarter. This is called a quarterly sales activity report, which is needed during quarterly business meeting. Quarterly business plans carry the more direct influence of senior management upon implementation than more frequent department- or division-level meetings have. It engages leadership team members throughout the year, fostering a management team culture that is conducive to the business’s success. Read more about quarterly sales activity report in our article today, and don’t forget to check out our free quarterly sales activity samples below:
7+ Quarterly Sales Activity Report Samples
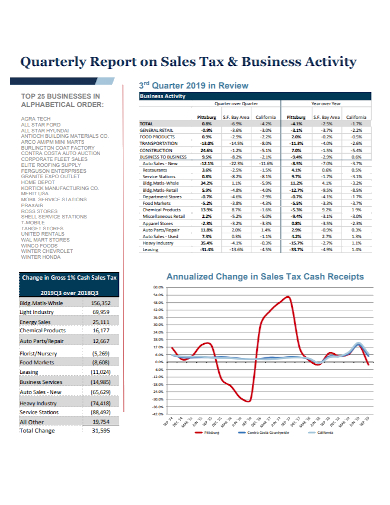
1. Quarterly Sales Business Activity Report
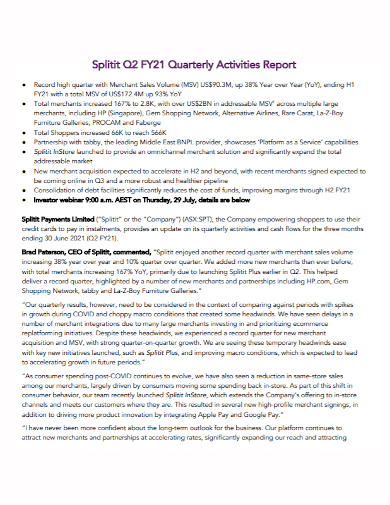
2. Quarterly Sales Volume Activity Report
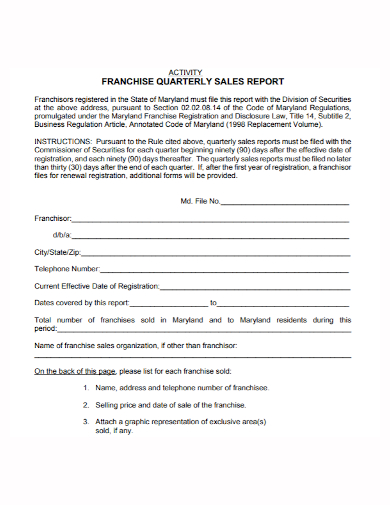
3. Franchise Quarterly Sales Activity Report
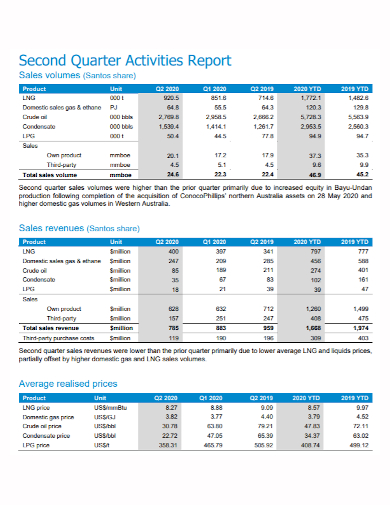
4. Second Quarterly Sales Activity Report
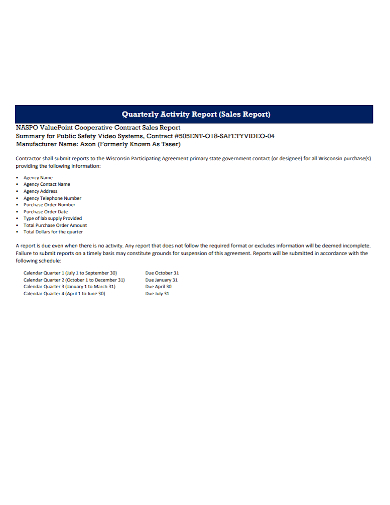
5. Quarterly Cooperative Sales Activity Report
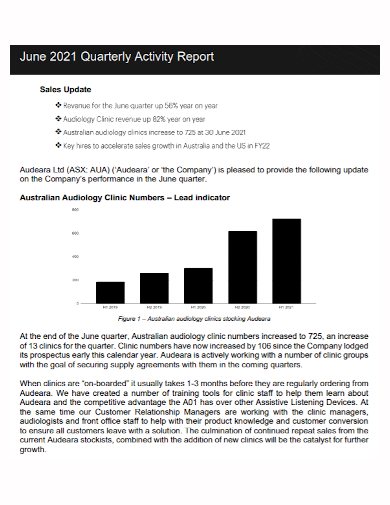
6. Quarterly Sales Update Activity Report
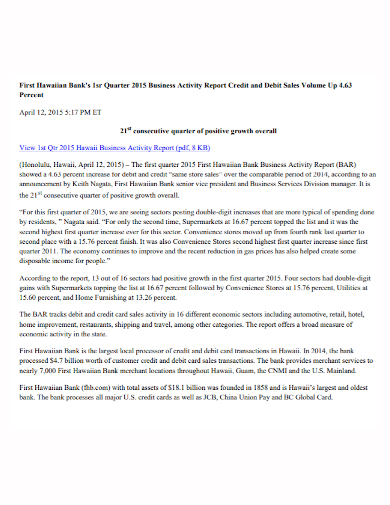
7. Bank Quarterly Sales Activity Report
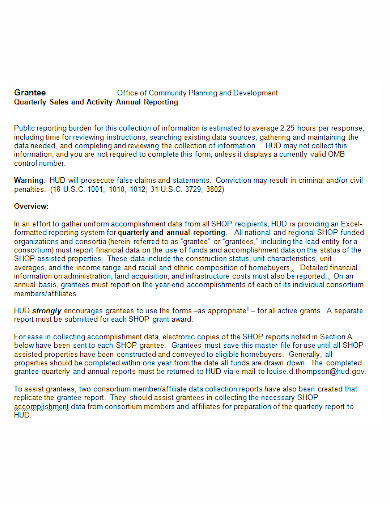
8. Quarterly Sales Activity Annual Report
What Is a Quarterly Sales Activity Report?
A sales activity report is a essential tool that can help increase your team’s performance and generate powerful sales results. Revenues are not the only items recorded in this report, it is a document that summarizes a business’s sales activities. This sales report typically includes information on sales volume, leads, new accounts, revenue and costs for a given period. It may show the different trends happening in the sales volume over a certain time, but also analyzes the different steps of the sales funnel and the performance of sales executives.
Sales activity reports are either generated on a daily, monthly, quarterly and yearly basis. A quarterly sales activity report is used a reference to determine if the sales target goals and revenue has been reached, to review your sales result from the previous quarter and to plan for the next successful quarter. It can also help you address sales management issues, indicate seasonal fluctuations, observe the impacts of marketing campaigns, and identify especially successful sales reps.
How To Create a Quarterly Sales Activity Report?
A quarterly sales activity report requires you to analyze and gather all the relevant sales data acquired from the last quarter. It can also help you address sales management issues, indicate seasonal fluctuations, observe the impacts of marketing campaigns, and identify especially successful sales reps. And once data is collected, you’ll want to encode this into an Excel spreadsheet which is the best tool for making quantitative reports such as a quarterly sales activity report. Here are some of the different kinds of sales reports that focuses on different sales metrics, needs or strategies:
- Sales call reports: which focuses on the calls placed to leads, prospects and customers to encourage purchases. Through these reports, you can gain insights into your sales rep performance and your leads’ qualities.
- Sales forecast: this type of reports demonstrate the predicted number of sales your team will make in a given period. This can also be used to identify anticipate seasonal slowdowns or plan for issues that might affect business flow.
- Sales funnel reports: this report will show the how certain sales activities can result to how close a lead is to buying your product or service. Sales funnels help you understand how to best nurture leads and, ultimately, convert them into customers.
As you are about to create your quarterly sales activity report, the following are the basic elements that comprises this report:
I. Key Performance Indicator
This is used by the sales team to track the effectiveness of relevant sales activities within a company. These measures help in optimizing your sales performance, sales funnel and sales cycle length.
II. Sales Volume
This is the total sales, in terms of units or revenue, for a specified period, which can be used as a reference to measure the effectiveness of a selling effort and method.
III. Net Sales
This is the monetary figure, whereas sales volume is simply the number of sales made. It consists of the sum of a company’s gross sales minus its returns, allowances, and discounts. Net sales calculations are not always transparent externally. They can often be factored into the reporting of top line revenues reported on the income statement.
IV. Gross Sales
This is the grand total of sales transactions in a given time period without any deductions from cost and other expenses.
V. KPI Change
This the percentage difference of the KPI in comparison to the previous reporting period
Aside from the typical figures in a sales report, it is always important to include written explanations to further help the reader understand the meaning behind those figures.
FAQs
What Is the Importance of Sales Reports?
Sales reports are important to guide business with their decision making by giving you a clear view of where your company stands at every level of your sales process. By focusing on measurable activities that have clear outcomes, you can add more value to each individual salesperson and the overall company.
Who Are Sales Managers?
Sales managers are members of an organization whose responsibilities oversee the sales activity process of a company. Which include assigning sales territories, setting quotas, mentoring the members of her sales team, assigning sales training, building a sales plan, and hiring and firing salespeople. In large companies, sales quotas and plans are usually set at the executive level, and a manager’s main responsibility is to see to it that her salespeople meet those quotas and uphold any policies passed down from above.
What Is the Difference Between Sales and Marketing?
Sales refers to all activities that lead to the selling of goods and services whereas a marketing is the process of getting people interested in the goods and services being sold.
A well written quarterly sales activity report can help top management identify what sales activities are doing well and which needs improvement. With the right figures in place, goal and objectives are either modified or added to fit the market trend and adapt to consumer behavior in the efforts to improve sales.
Related Posts
Sample Chemistry Lab Reports
School Accomplishment Report Samples & Templates
Field Report Samples & Templates
Sample Science Project Reports
Business Report Samples & Templates
Survey Reports Samples & Templates
Sample Feasibility Reports
Psychological Assessment Report Samples [ Clinical, Child, Intake ]
Report Format Samples & Templates
Acknowledgement for Internship Report Samples [ Hotel, Hospital, Teaching ]
Field Trip Report Samples [ Agriculture, Educational, Environmental ]
Student Counseling Report Samples
Narrative Accomplishment Report Samples [ Science, Teacher, Reading ]
Sample Acknowledgment Report Templates
Internship Narrative Report Samples