
Whether you operate in Europe, the Middle East, or Asia, as a businessman, you should know that the current raw material price may not be constant. Just like the U.S. exchange rate, it may change anytime. Thus, getting into a contract with suppliers using a supply price list with constant pricing changes can be risky for the survival of your business. To ensure that your business thrives amid global goods pricing woes, use the Producer Price Index which we are going to discuss in this article.
What Is a Producer Price Index?
Historically, in the U.S., people didn’t use the Producer Price Index until 1978. Businessmen used the Wholesale Price Index, which the Bureau of Labor Statistics published to monitor the price changes mirroring the industry’s supply and demand, construction, and manufacturing by focusing on the prices of the products between the corporations.
Meanwhile, the Bureau of Labor Statistics started to publish the Producer Price Index to monitor the average change of the prices of the products that domestic producers receive overtime. How does it work? It begins by using a base number of 100. It then shows changes in the future, which you can observe in a monthly period. At that time, the figure may decrease or increase, indicating a change in the production cost.
Countries, such as the United Kingdom, Japan, Brazil, Canada, etc., have adapted to use this type of price index. Unlike the Consumer Price Index, the Producer Price Index uses the producers’ point of view instead of the consumers.
Types Indexes Covered by Producer Price Index
In the previous section, we have discussed the Producer Price Index definition. Now, let’s talk about the data index classifications that the Producer Price Index provides.
1. Industry Classification
If you intend to observe the production cost changes at the industry level, you may want to take a look at this classification. Industry classification sorts the products by its production cost, which the authorities gathered by getting the industry’s output. Therefore, these are the results of the comparison of other economic programs involved in selling the products to another sector, such as the industry’s productivity, production, employment, salaries, and earnings.
2. Commodity Classification
On the other hand, if you want to observe the costs of the products and services based on their similarities or material compositions, regardless of the industry classification, use this index classification. PPI reports cover information of about 3,700 goods and 800 services price indexes and with this classification.
3. Commodity-based Final Demand-Intermediate Demand (FD-ID) System
Lastly, you can sort the data by its buyers’ types and costs involved to process and assemble the goods. Let us clarify, though, that in this sorting option, you will consider the buyers as the final demand(F.D.) or the intermediate demand(I.D.). The producer Price Index covers over 600 FD-ID indexes, which may help you conduct a useful analysis.
10+ Producer Price Index Samples
Take a look at the following Producer Price Index examples and compare them to how you picture it in your mind. You can download these zipped documents in PDF and M.S. Word formats.
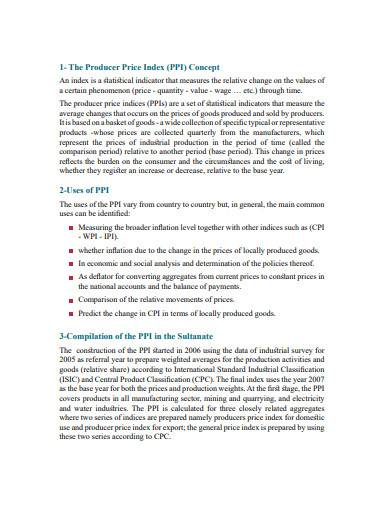
1. Producer Price Index Concept Sample
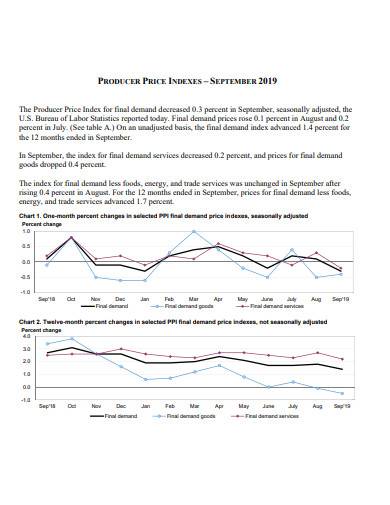
2. Producer Price Indexes Template
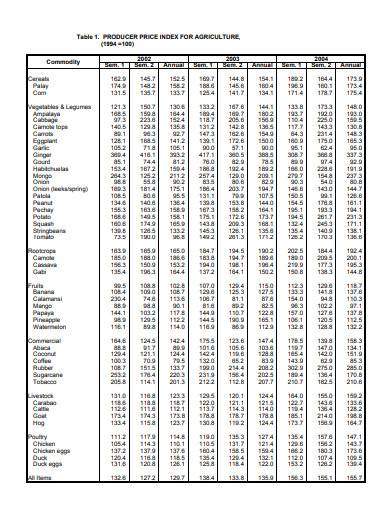
3. Producer Price Index for Agriculture Sample
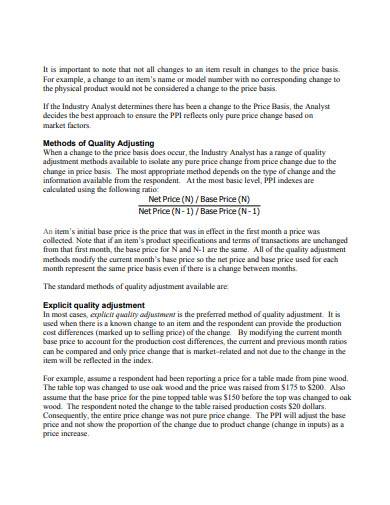
4. Quality Adjustment in the Producer Price Index Template
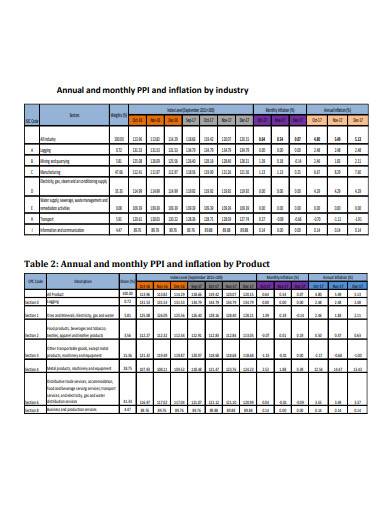
5. Annual and Monthly Producer Price Index and Inflation Industry
6. Producer Price Index Manufacturing Sample
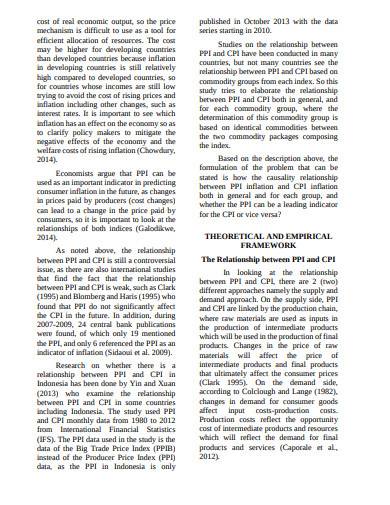
7. Analysis of Producer Price Index and Consumer Price Index
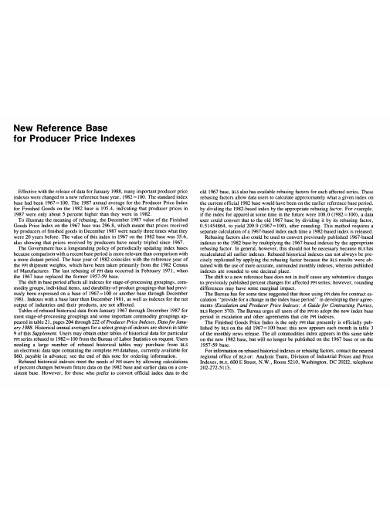
8. New Reference Base for Producer Price Indexes
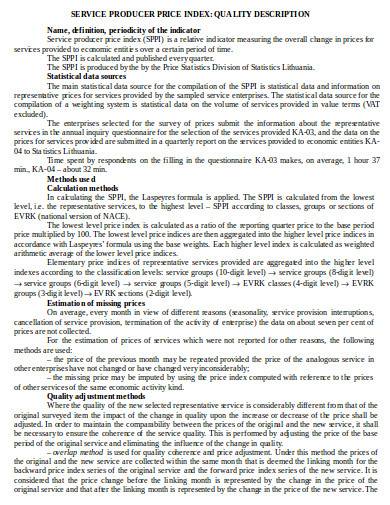
9. Service Producer Price Index in DOC
How to Calculate the Producer Price Index Changes
As you may have probably noticed, usually, the Producer Price Index reports show index changes in the form of percentage instead of the index points. Thus, in this article, we will discuss on how to get the Producer Price Index Changes in a percentage form.
1. Get the Current Index Point Change
To get this data, get the current period index level and the previous period index level. Its result will show the current period index level.
Index point change = Current period index level – Previous period index level
2. Get the Proportion of Change
Next, get the proportion of change by dividing index point change by the previous period index level.
The proportion of change = Index point change ÷ Previous period index level
3. Convert Proportion of Change to its Percentage Value
You can do it by multiplying the result of the third step by 100
Percent change = Proportion of change × 100
4. Check the Result.
To ensure that you are doing it correctly, compare the result of your calculation with the following example.
Let’s assume that we are going to determine the index changes for the first quarter of 2018. In December 2017, the recorded index level is 106.2, while in March 2018, we recorded an index level of 106.9. We will compute this problem this way
106.9 – 106.2 = 0.7
0.7 ÷ 106.2 = 0.006591337
0.006591337 × 100 = 0.6591337(0.66%)
This situation indicates that in the first quarter of 2018, there is a 0.66 percent price change between the previous period and the current period.
Did you know that the Producer Price Index is one of the vital global economic indicators? Meaning, since it indicates future changes, the authorities rely on this report to determine what action plan to take to prepare the future dilemma or other events. It makes learning how to interpret the data of this type of document vital not just for the progress of business but also for the country’s development. In this article, we have discussed the Producer Price Index formula and other vital information about this report. Take note, however, that although this document is an essential tool that will help you make your business thrive, you should not solely rely on it. In running a business, you also have to consider other factors to ensure its success.
Related Posts
Weekly Schedule Samples & Templates
Contractual Agreement Samples & Templates
FREE 9+ Amazing Sample Church Bulletin Templates in PSD | PDF
Sample Business Card Templates
Sample Cashier Job Descriptions
Questionnaire Samples
FREE 10+ Sample HR Resource Templates in PDF
FREE 10+ HR Consulting Business Plan Samples in MS Word | Google Docs | Pages | PDF
FREE 49+ Sample Job Descriptions in PDF | MS Word
FREE 16+ Nonprofit Budget Samples in PDF | MS Word | Excel | Google Docs | Google Sheets | Numbers | Pages
FREE 13+ Academic Calendar Templates in Google Docs | MS Word | Pages | PDF
FREE 10+ How to Create an Executive Summary Samples in Google Docs | MS Word | Pages | PDF
FREE 23+ Sample Event Calendar Templates in PDF | MS Word | Google Docs | Apple Pages
Company Profile Samples
FREE 10+ Leadership Report Samples [ Development, Training, Camp ]