
Ever wondered how companies allocate prices for their goods and services? Well, apart from their own calculations, they also have to keep track of price changes and State requirements. And one of their guides is the consumer price index that the U.S. Bureau of Labor Statistics computes.
What Is a Consumer Price Index?
The consumer price index, also known as the CPI, is the measurement of the average pricing of goods and services, as well as the pricing levels that companies must note. This is vital for operating any business regardless of the industry to avoid concerns related to overpricing. Also, the frequency of when the CPI gets computed depends on the country and state. Some states provide computations and estimations monthly, while some do it quarterly and yearly. The level of necessity of an item will also be a factor for the frequency of the CPI updates.
The Beginning of Consumer Price Indexing
Watching supermarket prices rise and fall, and seeing it rise again can be disappointing. But, it’s essential to note that price changes occur for various reasons, that even us consumers should also be aware of. So, when did it all start? When did the first consumer price indexing happen? Well, according to InflationData.com, the history of consumer price indexing is traceable back to World War I or 1917. Since then, it became an essential estimation for every industry, specifically for knowing the inflation rate.
What Can You Find In a Consumer Price Index Report?
If you’re searching for up-to-date reports and index notices for CPIs, then checking on the U.S. Bureau of Labor Statistics would be your best option. Why? Because they’re the ones legally authorized to post estimations and CPI charts. Furthermore, they also provide reports for the current CPI changes. Below are some of the data that you can find in a consumer price index report:
1. Specified Dates or Period of the CPI
How can one know that a CPI is a current one? Well, by looking at the dates stated at the topmost portion of the report. It must indicate the beginning and end dates of the estimations or observations.
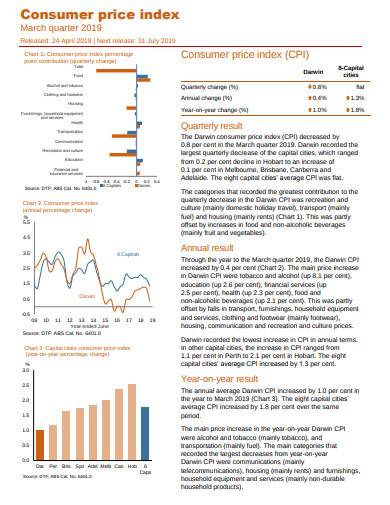
2. A Bar Graph and a Table
The reason why a bar graph is the one used for displaying CPIs is that it’s the best graphing method for massive changes. In the bar graph, the scale, labels, numerical representations on both axes, intervals, and the bars itself will be the contents. On the one hand, the table is for displaying the comparisons of the current CPI to the previous reports.
3. Statements and Explanations
When you see the table and graph, you might think that it’s no longer necessary to place detailed statements right below it, right? But, no. Just like any other scientific and mathematical reports, adding an explanation below the results will allow the readers to understand better. Apart from that, including details about the consumer price index formula will benefit those who want to dig deeper.
10+ Consumer Price Index Samples
Want to know how consumer price indexes look like? Then go through our list of sample templates that you can download and use to your advantage. Also, don’t worry, for it’s all made to be user-friendly:
1. Consumer Price Index Sample
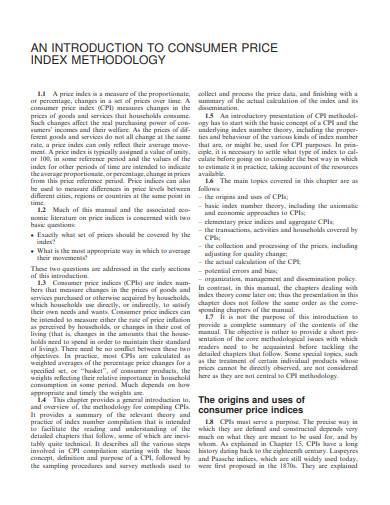
2. Consumer Price Index Methodology Template
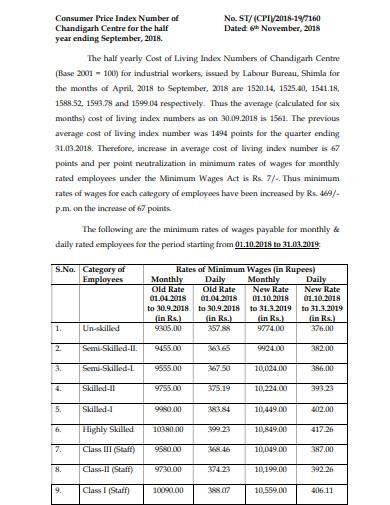
3. Consumer Price Index Number Sample
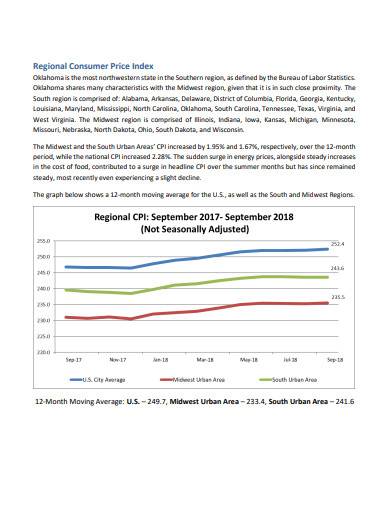
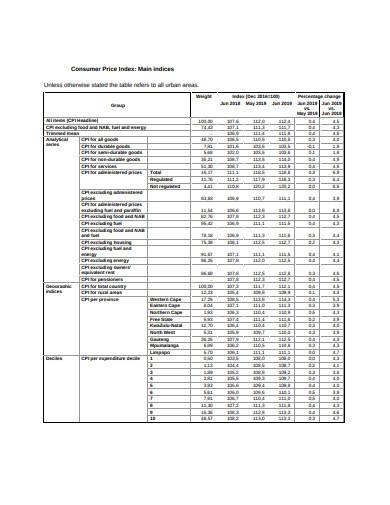
4. Regional Consumer Price Index Template
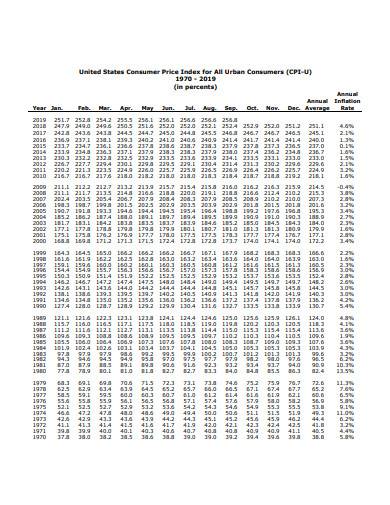
5. Consumer Price Index for all Urban Consumers Sample
6. Base Consumer Price Index Template
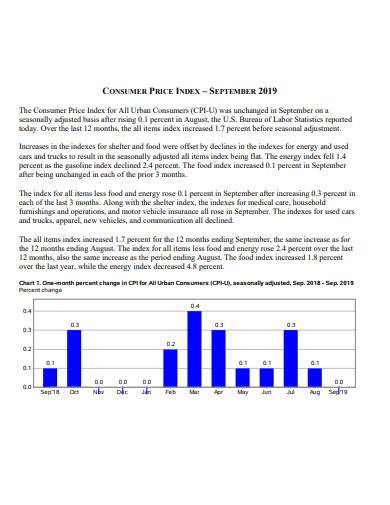
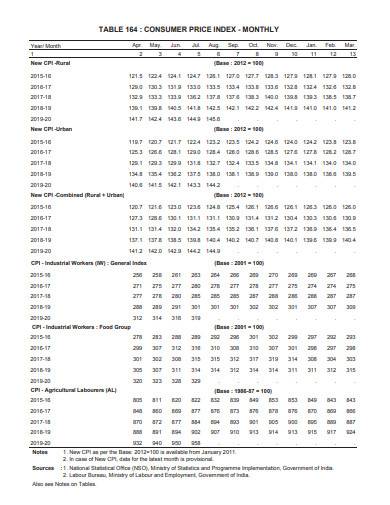
7. Monthly Consumer Price Index Sample
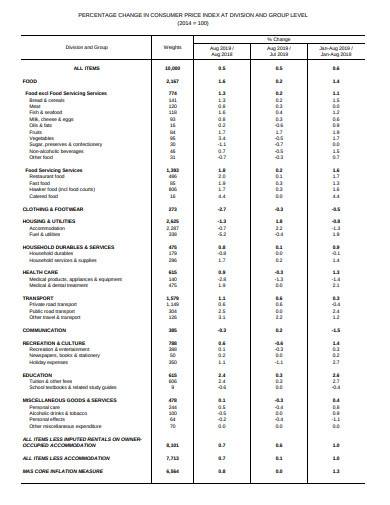
8. Percentage Change in Consumer Price Index at Division and Group Level
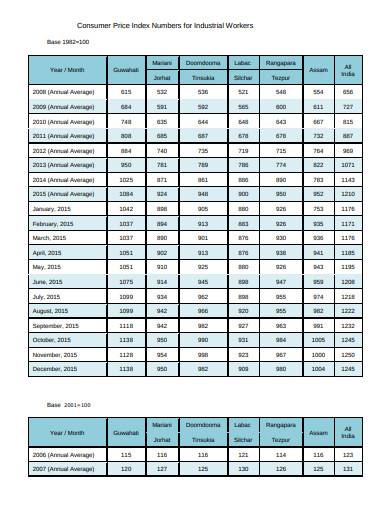
9. Consumer Price Index Numbers for Industrial Workers
10. Printable Consumer Price Index Sample
11. Consumer Price Index in DOC
Different Types of Consumer Price Index Documents
Apart from the usual consumer price index report, there are other documents and forms that both consumers and sellers can use to get informed of price changes. Below are some examples of the different types of documents to consider acquiring:
1. Consumer Price Index Methodology and Research Documents
Want to know more about the history of consumer price indexes and the results of researchers’ studies? Then a methodology and research document will be the best instrument that you can have. It will state the qualitative and quantitative methods that researchers used to understand and determine CPIs.
2. Regional Consumer Price Index Reports
What better way to compare prices and inflation rates than to have a comparison of changes from one local area to another, right? And for that, you will need the regional consumer price index reports for the regions that you want to compare. You can even have a price list and price quotations of goods and services for more specific comparison.
3. Urban Consumer Price Index Reports
The goods and services people consume in rural areas are different as compared to those in the urban setting. So, if you live in a rural area and want to compare your CPI from downtown’s, then an Urban Consumer Price Index Report would be your best tool. Once you get the comparisons, you can then proceed in plotting a graph or your own CPI study summary report to fully display their differences for your audience to understand.
Overall, consumer price indexes are relevant as well as other consumer-related reports; either we are consumers or sellers and manufacturers of goods and services. And, keeping track of such changes will allow you to be well-educated, as well as informed of what strategies you can do to benefit from it.
Related Posts
Weekly Schedule Samples & Templates
Contractual Agreement Samples & Templates
FREE 9+ Amazing Sample Church Bulletin Templates in PSD | PDF
Sample Business Card Templates
Sample Cashier Job Descriptions
Questionnaire Samples
FREE 10+ Sample HR Resource Templates in PDF
FREE 10+ HR Consulting Business Plan Samples in MS Word | Google Docs | Pages | PDF
FREE 49+ Sample Job Descriptions in PDF | MS Word
FREE 16+ Nonprofit Budget Samples in PDF | MS Word | Excel | Google Docs | Google Sheets | Numbers | Pages
FREE 13+ Academic Calendar Templates in Google Docs | MS Word | Pages | PDF
FREE 10+ How to Create an Executive Summary Samples in Google Docs | MS Word | Pages | PDF
FREE 23+ Sample Event Calendar Templates in PDF | MS Word | Google Docs | Apple Pages
Company Profile Samples
FREE 10+ Leadership Report Samples [ Development, Training, Camp ]