
The construction industry is a massive firing range, and corporations use multiple tactics and techniques to hit deadlines and be on-point with them. From tracking down their quarry to outgunning their opponent, if you want to win, you need reliable sources of knowledge, and adaptability to cope with the market’s demands. However, much like the actual sport, consistently hitting the bullseye is easier said than done. With that in mind, success in this industry is dictated not by who takes the most shots just by spraying and praying, but by whose strategy plan involves taking careful aim, firing accurately, and using the right ammunition.
Construction Company Gantt Chart Template
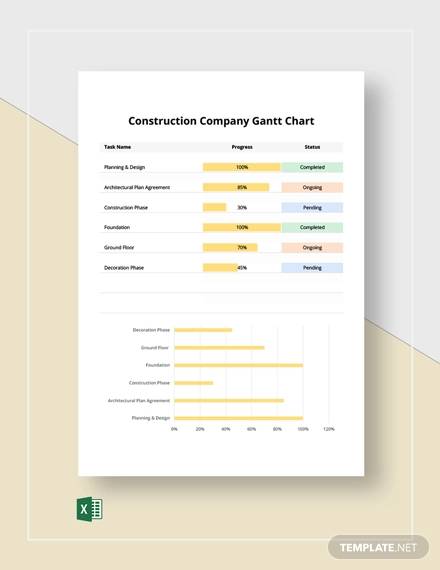
What is a Construction Gantt Chart?
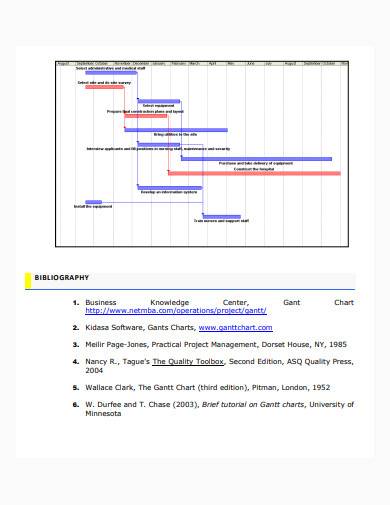
In Layman’s terms, a Gantt Chart is a combination of a bar graph, a calendar, and a checklist all rolled into one beautiful specimen. However, by looking closer, you can see that it’s more than just a hodgepodge of multiple documents, as the synergy becomes more evident the better you understand its purpose. A Gantt Chart’s goal is to break apart an entire project into numerous divisions, set it up beside a project timeline, and then track progress through checkpoints. This doesn’t just provide you with a vague estimate of work, but a vivid representation of development.
Due to its “natural properties,” this document is most often used for massive construction projects as it allows you to track progress in real-time. Extensive plans such as bridges, skyscrapers, and roads don’t just require plenty of workforce and resources; there are other things these plans need to succeed. These structures also require plenty of detail to be anywhere near safe and have to follow their schedule and deadline religiously lest they invoke mass inconvenience unto citizens. As such, construction Gantt Charts are used to foresee development, anticipate a delay, and provide data for you so that you can strategize and reach your target date of completion.
Bars, Charts, and Dams
A fun fact about the Gantt Chart is before it became commonly available as a software program, people had to be creative with how they moved the bars to represent development. Those tactics ranged from scribbling on chalkboards to using legos as bar graph representatives—all in the name of progress. However, the most significant contribution that Gantt Charts have made to modern society is found in near Arizona and Nevada, the Hoover Dam. Furthermore, Gantt Charts played a substantial role in the project management for the Hoover Dam’s construction.
From here on end, Gantt Charts are considered a staple in construction project management. It has become the most widely accepted document used to track infrastructure development—and for good reason. Despite its meticulous and sophisticated layout, the accuracy at which a Gantt Chart can provide you information outways the previously-mentioned disadvantages. Hence, if a Gantt Chart can assist builders back in 1931 in building the Hoover Dam, it can help you with your modern-day construction ideas.
Construction Gantt Chart Samples in PDF | DOC
It doesn’t hurt to have a bit of help when drafting your document. Following this, here are a few sample templates you can use to get you started.
1. Construction Gantt Chart Sample
2. Construction Gantt Chart Template
3. Constructing Gantt Chart Sample
4. Constructing Gantt Chart Example
5. Formal Constructing Gantt Chart Template
6. Simple Constructing Gantt Chart in PDF
7. Basic Constructing Gantt Chart Sample
8. General Constructing Gantt Chart Template
9. Constructing Gantt Chart in PDF
10. Constructing Gantt Chart in DOC

11. Sample Constructing Gantt Chart Template
How to Create a Construction Gantt Chart?
In the ye olde days of construction, people had to be creative in making their construction management plans. As time went on, despite a few tweaks and improvements, the relative structure of effective Gantt Charts remained the same. However, despite its now refined system and adaptation to modern technology, drafting one for yourself still requires extensive research, document comprehension, and even progress reporting to an extent. With this in mind, you can use these tips and tricks to make your work more convenient.
1. Understand Your Project
First and foremost, you need to understand your project. This may sound like a generic and repetitive tip, but if you chew it down to the bone, very few people truly know what this means. For instance, when you say you understand that you’re building a bridge, it doesn’t just mean generic bridge-building techniques are all you need. What are some complications with the project? Is it on land? Are the foundations underwater? Fully comprehend the task at hand and organize a construction phase plan to increase the odds of success.
2. Set Tasks in a Chronological Order
Akin to a work schedule, a Gantt Chart’s layout consists of listing all the processes in chronological order from top to bottom. This is done to give you an idea of what processes can’t be started without finishing its predecessor, and what parts of the project can overlap to save time. Doing it this way also lets you pinpoint areas of delay in your project to quickly deal with them.
3. Stay Practical
A Gantt Chart can only truly help you if you set realistic goals in mind. Think about it; there’s no possible way in this current time and era that a 15-foot skyscraper can be built in two weeks. As such, the dates you set on your chart should be practical and achievable. Hence, running a feasibility report concerning the project’s duration beforehand is advised to ensure that you’re not aiming at an unreachable star.
4. Utilize Online Software
You can’t deny the fact that technology has drastically improved our lives. It has made everyday life more convenient, our streets safer, and our businesses more efficient—and the Gantt Chart is no exception. Nowadays, it’s easy to find reliable software specially designed for these project-management miracles. When looking for online solutions, however, do make sure that they come from reliable sources to avoid getting scammed, hacked, or worse. In spite of this, when you do find a trustworthy construction Gantt Chart software, you’ll have the convenience you want without compromising the quality you need.It’s tough to imagine a construction project plan that hasn’t utilized a Gantt Chart at this point. The meticulousness of drafting is only a small inconvenience when compared to the precision and time management it offers. To top it all off, this document already has multiple titles under its belt—with its most iconic feat being the completion of the Hoover Dam. However, the true testament to this chart’s success is the fact that despite the rise of modern technology, the Gantt Chart didn’t adapt to meet the demand; instead, modern technology adapted to fit the Gantt Chart.
Related Posts
Weekly Schedule Samples & Templates
Contractual Agreement Samples & Templates
FREE 9+ Amazing Sample Church Bulletin Templates in PSD | PDF
Sample Business Card Templates
Sample Cashier Job Descriptions
Questionnaire Samples
FREE 10+ Sample HR Resource Templates in PDF
FREE 10+ HR Consulting Business Plan Samples in MS Word | Google Docs | Pages | PDF
FREE 49+ Sample Job Descriptions in PDF | MS Word
FREE 16+ Nonprofit Budget Samples in PDF | MS Word | Excel | Google Docs | Google Sheets | Numbers | Pages
FREE 13+ Academic Calendar Templates in Google Docs | MS Word | Pages | PDF
FREE 10+ How to Create an Executive Summary Samples in Google Docs | MS Word | Pages | PDF
FREE 23+ Sample Event Calendar Templates in PDF | MS Word | Google Docs | Apple Pages
Company Profile Samples
FREE 10+ Leadership Report Samples [ Development, Training, Camp ]