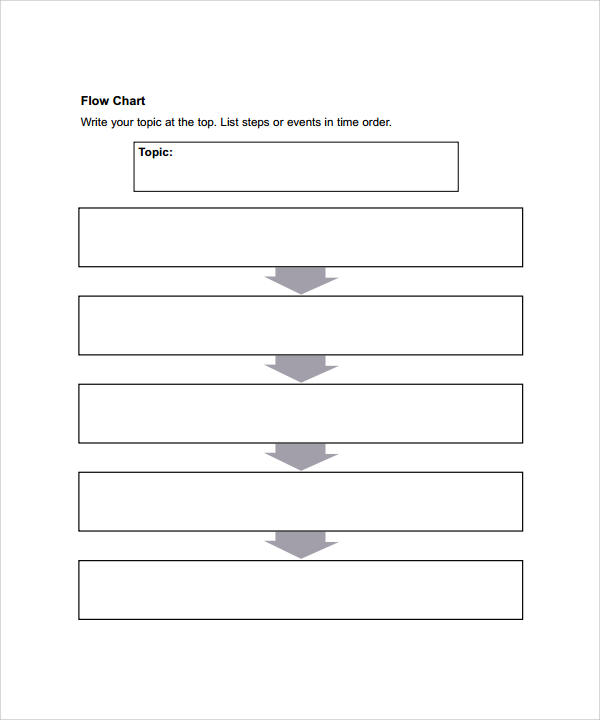
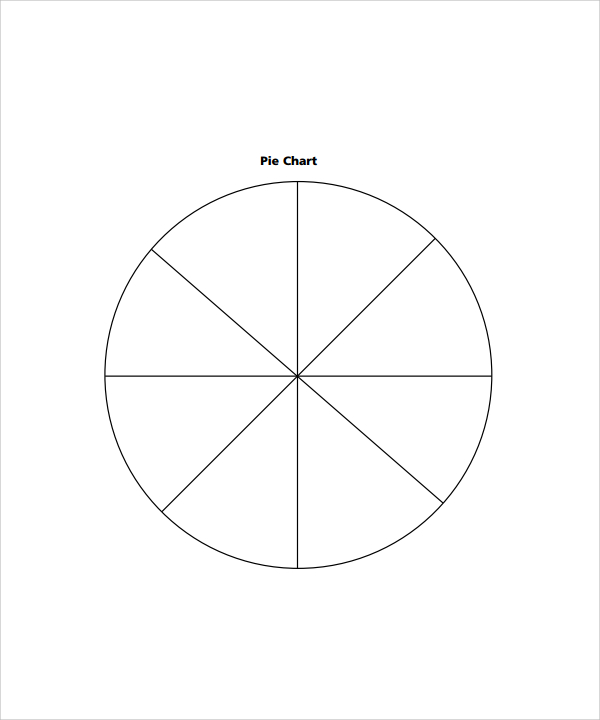
A chart is a graphic representation of data. The data in these charts are represented by symbols. These symbols can come in the form of lines as in line charts, bars as in bar charts, and pizza slices as in pie charts. There are still other symbols that can be used for different types of charts.

A chart is a graphic representation of data. The data in these charts are represented by symbols. These symbols can come in the form of lines as in line charts, bars as in bar charts, and pizza slices as in pie charts. There are still other symbols that can be used for different types of charts.

Charts make boring reports look interesting. While it is not hard to create a chart, the preparation of data needed to be put in a chart and how it should look like is challenging. Beginners find it really difficult. For you to save a lot of your time and effort, you should download these free charts that we have available online. Gantt Chart are also available here.

Free Gantt Charts

Project Gantt Chart

Details
File Format
  • PDF

Size: 854 KB

Download

Construction Gantt Chart

Details
File Format
  • PDF

Size: 274 KB

Download

Blood Pressure Charts

Record Blood Pressure Chart

Details
File Format
  • PDF

Size: 38 KB

Download

Blood Pressure Chart for Adults

Details
File Format
  • PDF

Size: 41 KB

Download

What Does a Gantt Chart Show?

What is a Gantt chart? A Gantt Chart is a used to show the start and finish dates of certain elements, or in other words, it shows the amount of production or work that is done within a scheduled or planned period of time. It was created by Henry Gantt during the 1910s to make a visualization or a picture of a schedule for a project or program.

The Gantt chart shows the following components:

  • The date shows when the project will start and the date when it will end.
  • A bar graph is the type of chart that is used in a Gantt chart and represents the span of time a certain task should take to be done.
  • A vertical line marker is an indication of the current date on the chart. It is also a way to to see a chart’s process at a glance.
  • Shaded task bars shows the progress of the project. By shading the task bars, you can easily identify what tasks are already completed.
  • A list of tasks are included in the Gantt chart to help determine what has to be done in a certain project.

Free Flow Charts

Process Flow Chart

Details
File Format
  • PDF

Size: 459 KB

Download

Work Flow Chart

Details
File Format
  • PDF

Size: 41 KB

Download

Basic Flowchart

Details
File Format
  • PDF

Size: 339 KB

Download

Organization Charts

Project Organization Chart

Details
File Format
  • PDF

Size: 4 KB

Download

Company Organization Chart

Details
File Format
  • PDF

Size: 83 KB

Download

Business Organization Chart

Details
File Format
  • PDF

Size: 72 KB

Download

Seating Charts

Auditorium Seating Chart

Details
File Format
  • PDF

Size: 1 MB

Download

City Field Seating Chart

Details
File Format
  • PDF

Size: 74 KB

Download

Hall Floor Seating Chart

Details
File Format
  • PDF

Size: 476 KB

Download

How to Create a Chart

We come across charts in school, work, books, and newspapers. Some time in our lives we are tasked to make one. There are different types of charts that you can choose to make. It may not be easy at first, but once you get the hang of it, it will all be easy. You can also download the free charts that we are offering in this article. If not, we have here some steps on how you can create a chart.

  • You don’t always start with drawing the chart when you make one. The first step is to gather the data that is needed for the chart. You may need to calculate or collate these data depending on their sources.
  • After gathering the data, sort it out first. A chart should be organized for it to be easily understood. Like and related data should go together or they should be side by side. Putting the data on the chart strategically makes your chart effective.
  • Once data has been sorted, the next step is selecting the type of chart that you will use. Not all charts can be used for all types of presentation. There are charts that can only be used for specific things. You should choose the type of chart carefully. If the type of chart you chose to make is compatible with the data you just gathered, then you may need to start over and that is just a waste of time.
  • Choose your graph colors accordingly. If you are making a chart for a business presentation, you might want to use neutral colors. The colors used in the business can also be used in the chart.
  • Before making copies or finally saving your work, spell-check and proofread it. Double-check if the data that you have gathered are all correct.


We also have Organizational Charts and Seating Charts available for download.

Free Chore Charts

Kids Chore Chart

Details
File Format
  • PDF

Size: 195 KB

Download

Daily Chore Chart

Details
File Format
  • PDF

Size: 140 KB

Download

Roommate Chore Chart

Details
File Format
  • PDF

Size: 1 MB

Download

Reward Charts

Aeroplan Reward Chart

Details
File Format
  • PDF

Size: 257 KB

Download

Reward Chart Sample

Details
File Format
  • PDF

Size: 284 KB

Download

Behavior Chart Template

Details
File Format
  • PDF

Size: 318 KB

Download

Behavior Modification Charts

Elementary Behavior Chart

Details
File Format
  • PDF

Size: 53 KB

Download

Weekly Behavior Chart

Details
File Format
  • PDF

Size: 43 KB

Download

Cleaning Charts

Daily Cleaning Chore Chart

Details
File Format
  • PDF

Size: 6 KB

Download

Cleaning Schedule Chart

Details
File Format
  • PDF

Size: 28 KB

Download

Tips to Create Impressive Chart

After knowing about the steps to create a chart, we will now give you some tips to make your chart look impressive. An effective chart is always the goal for anyone who wishes to make a chart. But it is also nice to go the extra mile and make your chart look impressive. You can also take a look at our Chore Charts and Blood Pressure Charts.

  • It is important that you choose the right type of graph for your chart. You should have your data displayed in the best possible way. Worry first if it is the best type of graph for your chart for the data that you have at hand. It is important to consider its compatibility with other factors.
  • Sort your graph in a way that is easy to understand, like putting a bar graph in descending or ascending order. That way it won’t look so random.
  • Try to shorten your labels. Your labels may not be shown fully or may be cut if they are too long.
  • Move your legends to places where they will tend to look neat.
  • Do not put a legend if it is only a single data series.
  • Avoid making charts that make people’s head tilt. The simpler the better.

Free Weight Loss

Weight Conversion Chart

Details
File Format
  • PDF

Size: 146 KB

Download

Pet Weight Loss Diet Chart

Details
File Format
  • PDF

Size: 313 KB

Download

Growth Charts

Baby Growth Chart

Details
File Format
  • PDF

Size: 410 KB

Download

Growth Chart for Boys

Details
File Format
  • PDF

Size: 412 KB

Download

Size Charts

Footwear Size Chart

Details
File Format
  • PDF

Size: 11 KB

Download

Clothing Size Chart

Details
File Format
  • PDF

Size: 9 KB

Download

Men’s Shoe Size Chart

Details
File Format
  • PDF

Size: 519 KB

Download

Loan Amortization Charts

EMI Amortization Calculator Chart

Details
File Format
  • XLSX

Size: 16 KB

Download

Mortgage Amortization Loan Chart

Details
File Format
  • XLSX

Size: 15 KB

Download

Pareto Charts

Dynamic Pareto Chart

Details
File Format
  • XLSX

Size: 18 KB

Download

Pareto Run Chart

Details
File Format
  • PDF

Size: 309 KB

Download

Basic Pareto Chart

Details
File Format
  • PDF

Size: 268 KB

Download

Free Control Charts

Quality Control Chart

Details
File Format
  • PDF

Size: 117 KB

Download

Individual Control Chart

Details
File Format
  • PDF

Size: 128 KB

Download

Variable Control Chart

Details
File Format
  • PDF

Size: 60 KB

Download

Clothing Size Chart

clothing size chart1

Details
File Format
  • DOC

Size: 109 KB

Download

Types of Charts

Reading a lot of data in words or in numbers can be really boring, especially if there are tons of them. An easier way is not just to read data but look at it. Looking at data is possible if they are put into charts. Charts allow the readers to visualize data easily. There are different types of charts that can be used for different purposes. The types and uses of each chart are explained below.

  • A histogram is a type of chart where the data entered is continuous. It is used in assessing the shape of the data as well as the spread of continuous data. It is often confused with bar graphs.
  • Bar graphs are shown as rectangular bars whose height or length are in proportion to the values of the data that they represent.
  • If you have seen a pizza pie, then you can imagine how a pie chart looks like. A pie chart is used to represent data that are about a percentage of something. Each slice is distinguished because of their different colors and sizes.
  • A line chart makes up a graph through lines that go up or down, or in a zigzag pattern depending on the corresponding data that they represent.


You may also find our Behavior Charts and Loan Amortization Charts useful. You can look around our website if you are interested in other or similar charts. Once you find something suitable to your needs and specifications, you may download them as they are for free!

Related Posts