
The Research Gantt Chart provides an effective way of planner samples and organizing the task lists involved in a research project template. It enables researchers to break down the project into smaller tasks, assign them to team members, and allocate resources accordingly. The chart helps researchers to visualize the timeline outline of the project and identify the critical review samples that must be completed on time to ensure the success of the project. By breaking down the project into smaller tasks and assigning them to team members, researchers can ensure that the project progresses smoothly, and deadlines are met.
FREE 10+ Research Gantt Chart Samples & Templates
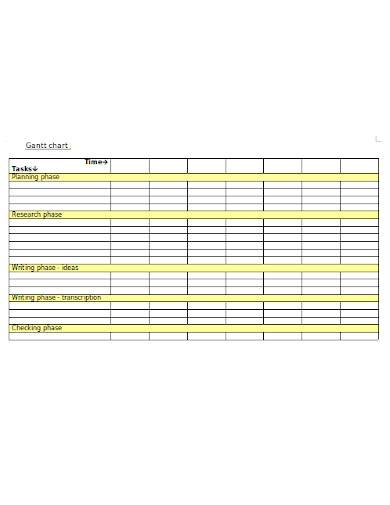
1. Research Gantt Chart Template
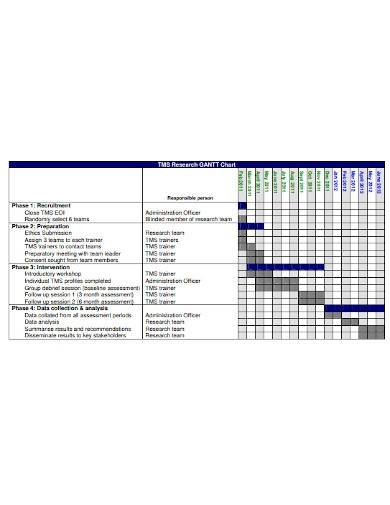
2. Sample Research Gannt Chart
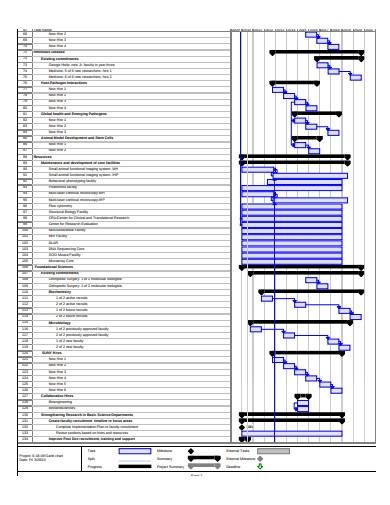
3. Research Implementation Gannt Chart
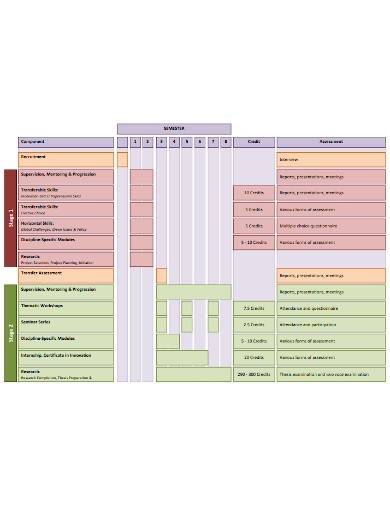
4. Student Research Gantt Chart
5. Operational Research Gantt Chart
6. Sample Research Project Gantt Chart
7. Research Gantt Chart Framework
8. Research Proposal Gantt Chart
9. Masters Research Proposal Gantt Chart
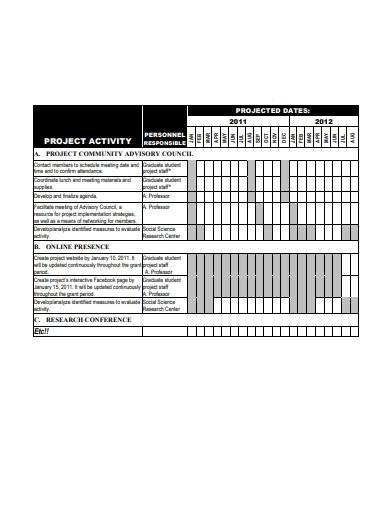
10. Research Project Activity Gannt Chart
11. Basic Research Project Gantt Chart
What is Research Gantt?
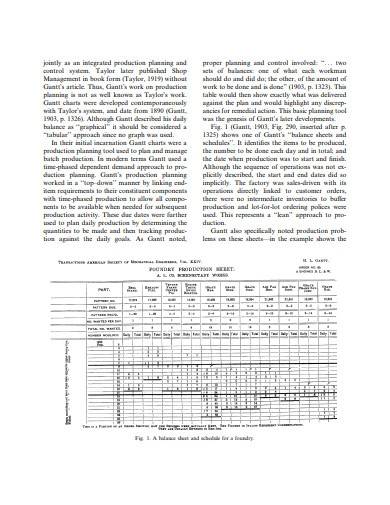
A Research Gantt Chart is a graphical representation of a research project schedule samples that shows the timeline samples of various tasks, project milestones, and deadlines associated with the project. It is a commonly used project management tool that helps researchers and project managers plan, track, and manage research projects effectively.
How To Make Research Gantt?
The Research Gantt Chart is also an important communication tool. It enables researchers to communicate the project timeline and progress to stakeholders and collaborators effectively. By providing a visual representation of the project timeline, stakeholders can easily understand the progress of the project and identify any potential issues. This helps to ensure that everyone involved in the project is on the same page and that the project is progressing smoothly. To create a Research Gantt Chart, you can follow the steps outlined below:
Step 1- Identify Key Tasks
Start by listing all the major tasks that need to be completed during the project. These could include activities such as literature review samples, data collection, data analysis, writing up the report, and so on. Estimate how long each task will take to complete. Be realistic in your estimates and consider any potential delays or issues that may arise.
Step 2- Identify Dependencies
Determine which tasks need to be completed before others can begin. For example, data collection cannot begin until the research design has been finalized.Based on the duration and dependencies of each task, determine when each task will start and when it is expected to be completed.
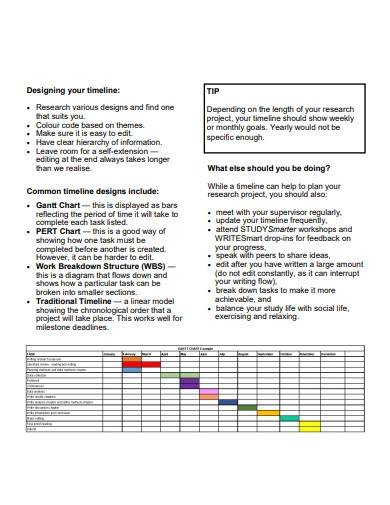
Step 3- Create Gantt Chart
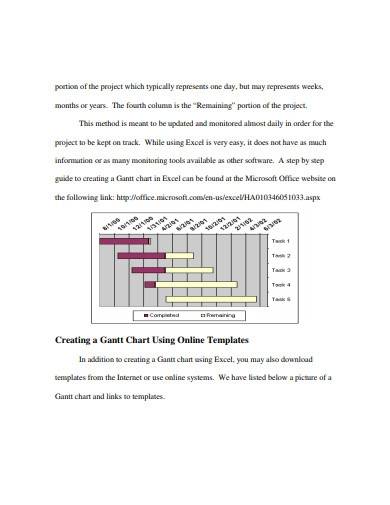
Use a software tool or a spreadsheet program to create your Gantt Chart. The chart should include a timeline of the project duration, with each task represented by a horizontal bar. The length of the bar should represent the duration of the task, and its position should indicate its start and end date. Add key milestones to your Gantt Chart, such as the submission deadline or any major presentations.
Step 4- Review and Adjust
Review the Gantt Chart and make any necessary adjustments to ensure that the timeline is feasible and that all dependencies have been taken into account. Update the Gantt Chart regularly to reflect any changes or delays that occur during the project. This will help you to stay on track and ensure that the project stays on schedule.
What information is included in a Research Gantt Chart?
A Research Gantt Chart typically includes a list of tasks or activities that need to be completed during the research project, the start and end dates of each task, and the dependencies between them. The chart also shows the duration of each task and the progress made towards completing it.
How do I create a Research Gantt Chart?
To create a Research Gantt Chart, you need to identify the key tasks involved in your research project, determine the duration of each task, identify dependencies between tasks, determine the start and end dates for each task, create a Gantt Chart, add milestones, review and adjust, and update regularly.
How do I use a Research Gantt Chart?
To use a Research Gantt Chart, you should refer to it regularly to ensure that you are staying on track with the project schedule. You can use the chart to identify critical tasks, track progress, and adjust the schedule as needed. You can also use the chart to communicate the project timeline and progress to stakeholders and collaborators.
A Research Gantt Chart is important because it helps researchers plan, manage, and track their research projects effectively. It provides a visual overview of the project timeline, helps identify critical tasks, tracks progress, and communicates the project schedule to stakeholders.
Related Posts
FREE 10+ Content Validity Samples & Templates in PDF
FREE 10+ Construct Validity Samples & Templates in MS Word | PDF
FREE 10+ Code of Human Research Ethics Samples & Templates in MS Word | PDF
FREE 10+ Biography Research Report Samples and Templates in PDF
FREE 10+ System Documentation Samples & Templates in MS Word | PDF
FREE 10+ Process Document Samples & Templates in MS Word | PDF
FREE 10+ Action Research Samples & Templates in PDF
FREE 10+ Longitudinal Research Samples & Templates in PDF | MS Word
FREE 10+ Causal Research Samples & Templates in MS Word | PDF
FREE 10+ Client Discovery Samples & Templates in MS Word | PDF
FREE 10+ Null Hypothesis Samples & Templates in MS Word | PDF
FREE 9+ Product Knowledge Samples & Templates in PDF
FREE 10+ Software Documentation Samples & Templates in MS Word | PDF
FREE 10+ Exploratory Research Samples & Templates in PDF | MS Word
FREE 10+ Experimental Research Samples & Templates in MS Word | PDF