
One can explain a process through writing paragraphs, but showing the flow of a procedure through a chart would be better. Graphic presentations make it easier for people to comprehend information, especially complex ones. One type of chart you may be familiar with is a flowchart. Thanks to Frank and Lillian Gilbreth for introducing the concept of documenting business processes in a more understandable and efficient manner. These industrial engineers introduced the process flowchart in the 1920s. And up until today, organizations and individuals still make use of the said diagram.
50+ Sample Flow Chart Templates
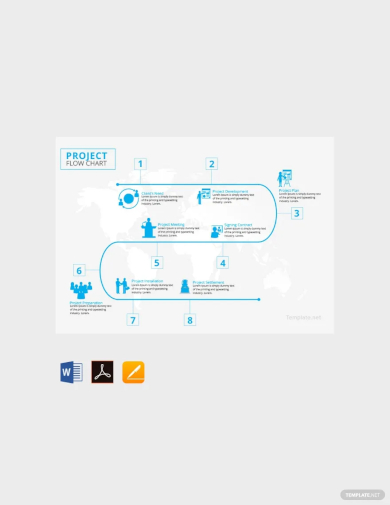
1. Project Flow Chart Template
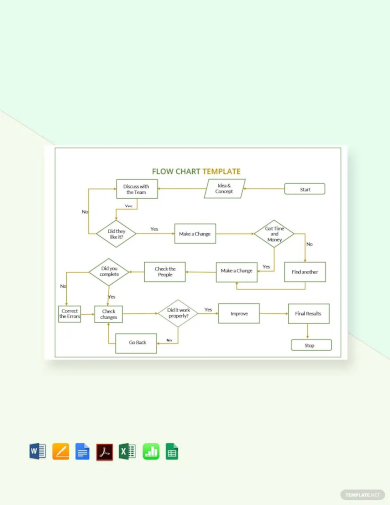
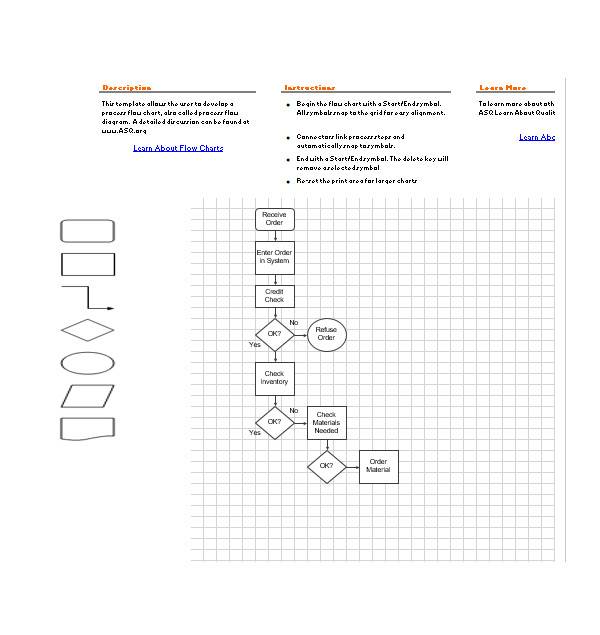
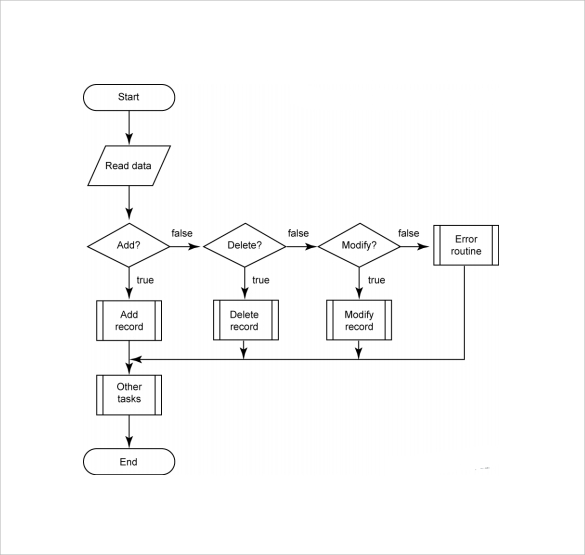
2. Sample Flow Chart Template
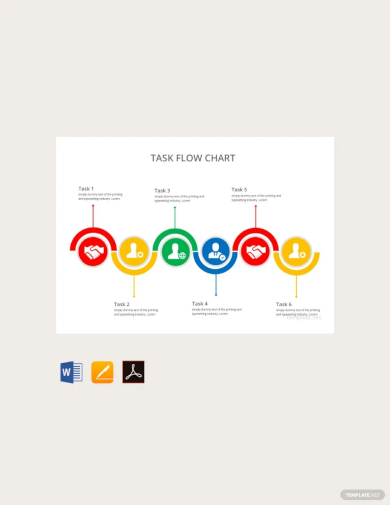
3. Task Flow Chart Template
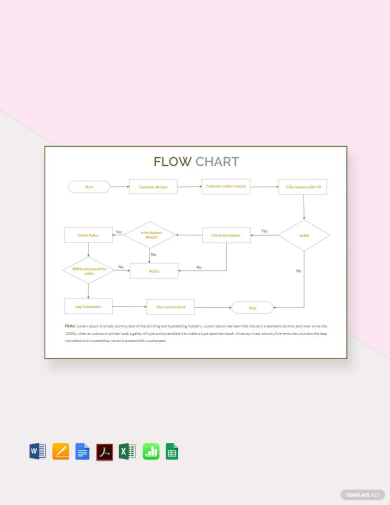
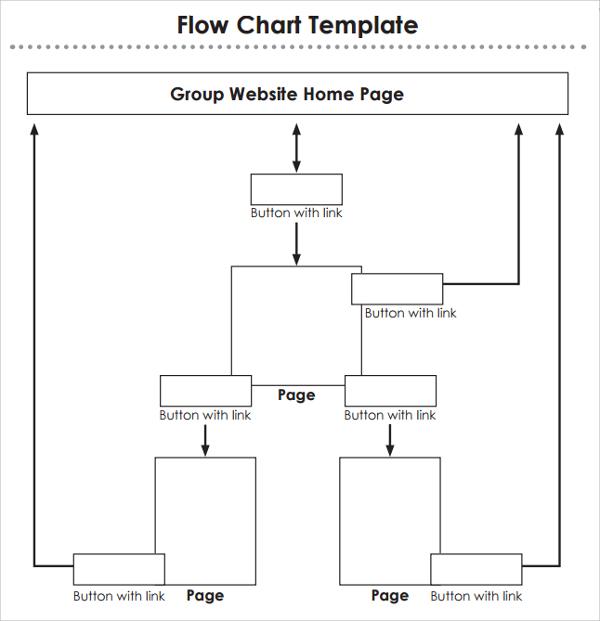
4. Flow Chart Template
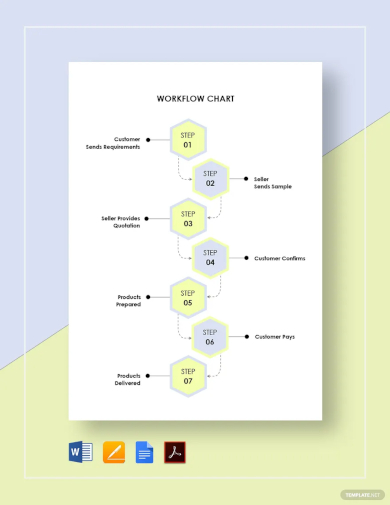
5. Work Flow Chart Template
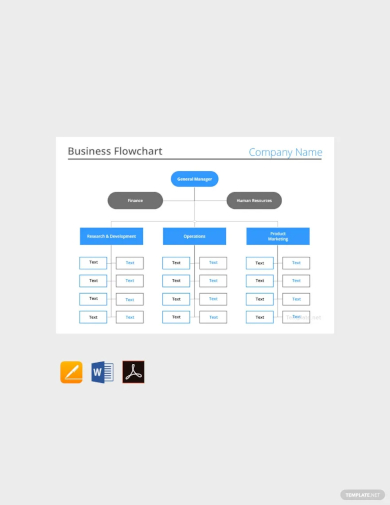
6. Business Flow Chart Template
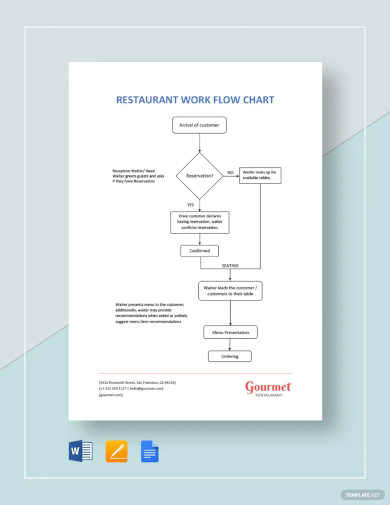
7. Restaurant Work Flow Chart Template
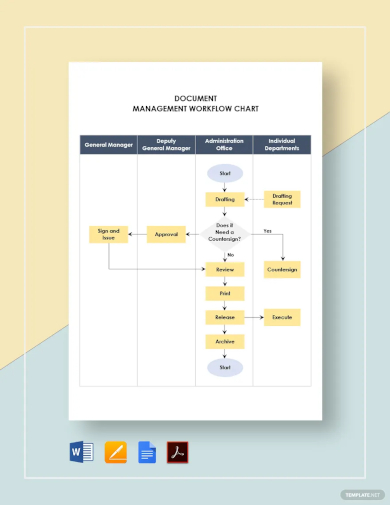
8. Document Management Work Flow Chart Template
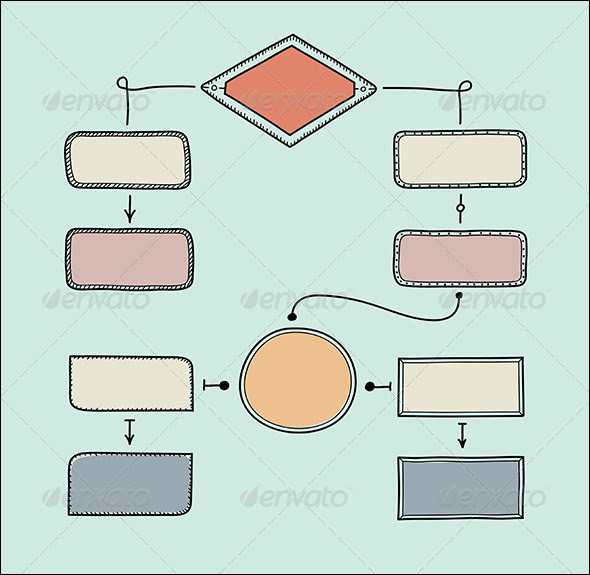
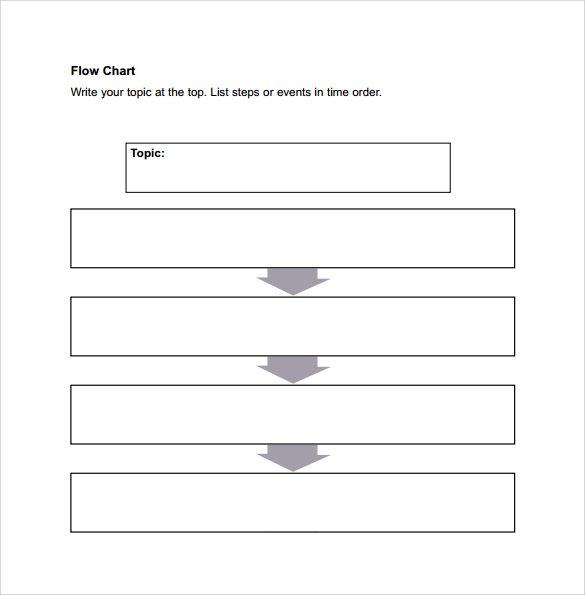
9. Free Blank Flow Chart Template
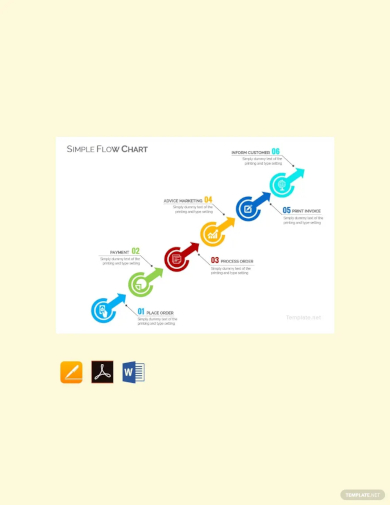
10. Simple Flow Chart Template
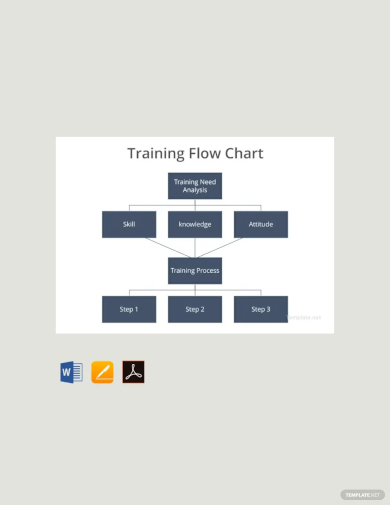
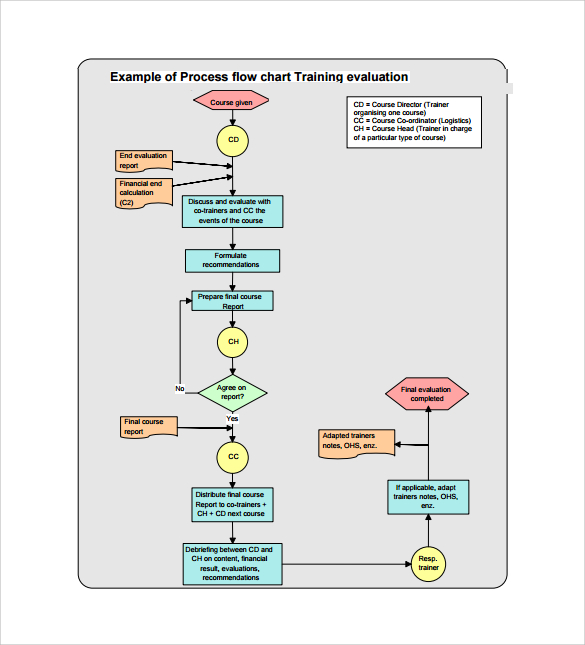
11. Training Flow Chart Template
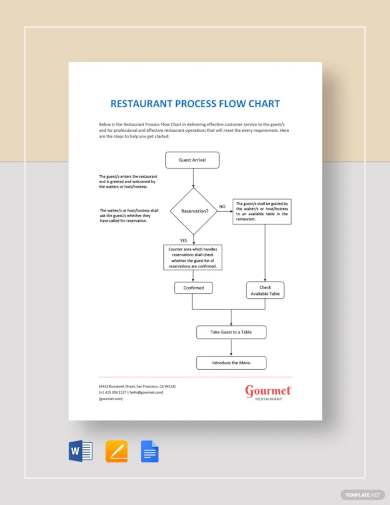
12. Restaurant Process Flow Chart Template
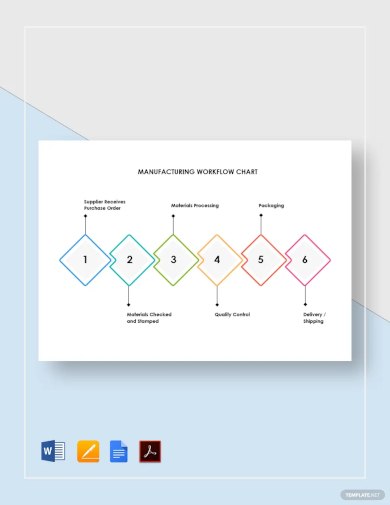
13. Manufacturing Work Flow Chart Template
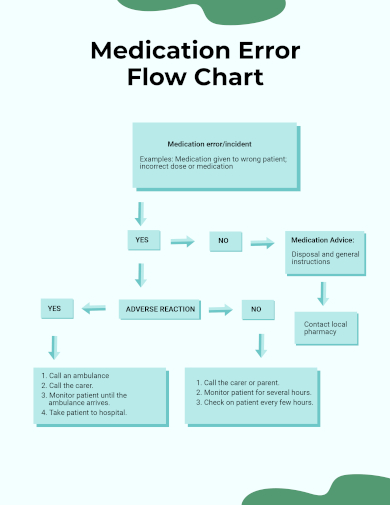
14. Medication Error Flow Chart
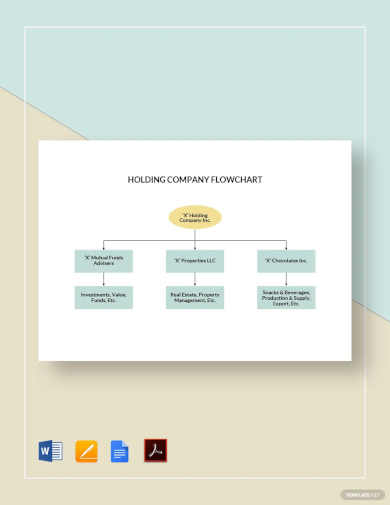
15. Holding Company Flow Chart Template
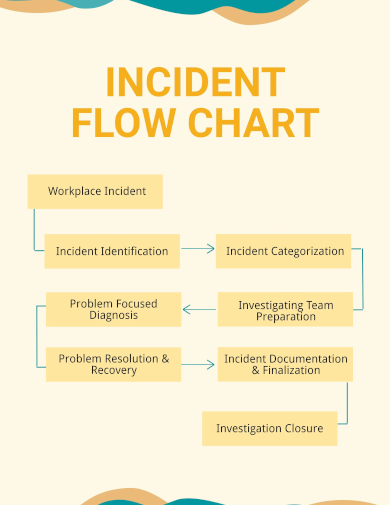
16. Incident Flow Chart Template
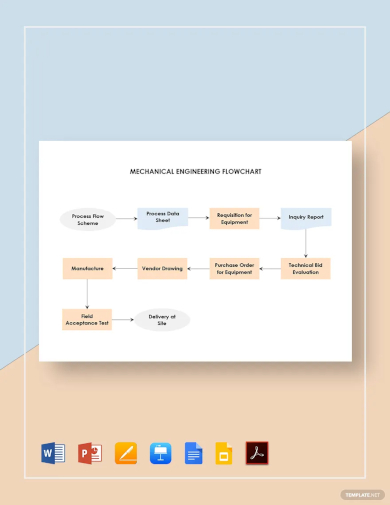
17. Mechanical Engineering Flow Chart Template
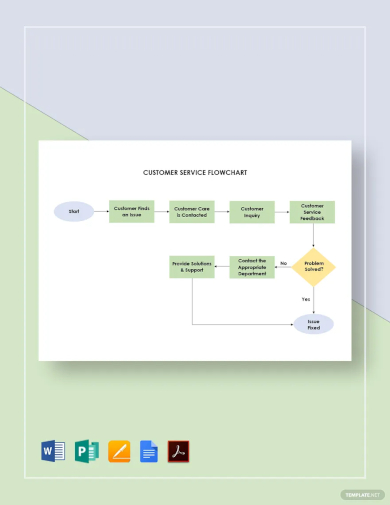
18. Customer Service Flow Chart Template
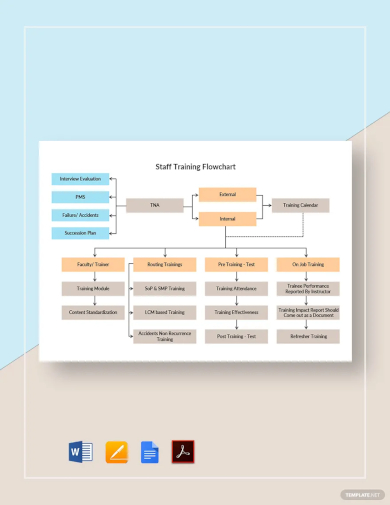
19. Staff Training Flow Chart Template
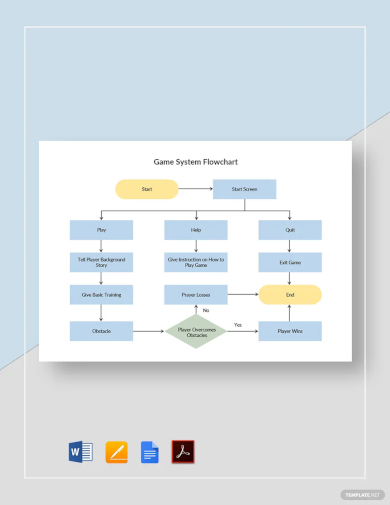
20. Game System Flow Chart Template
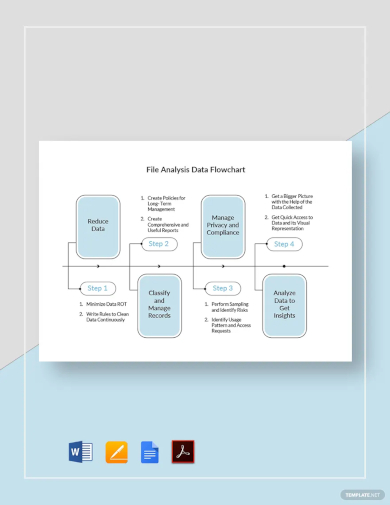
21. File Analysis Data Flow Chart Template
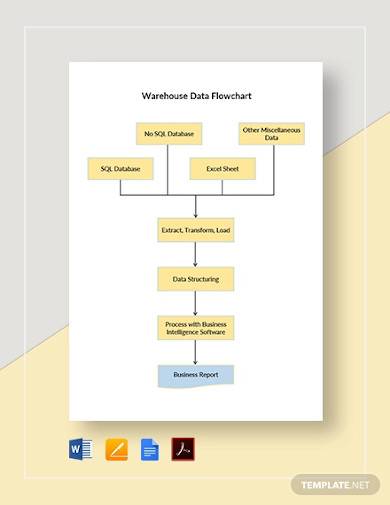
22. Warehouse Data Flow Chart Template
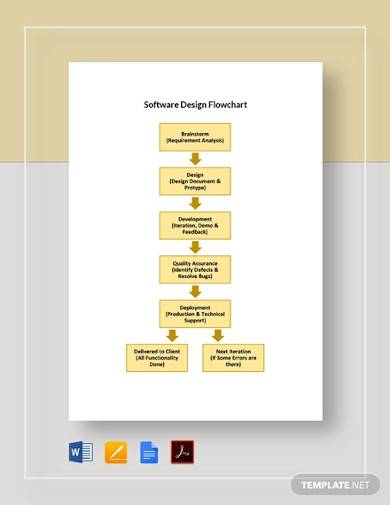
23. Software Design Flow Chart Template
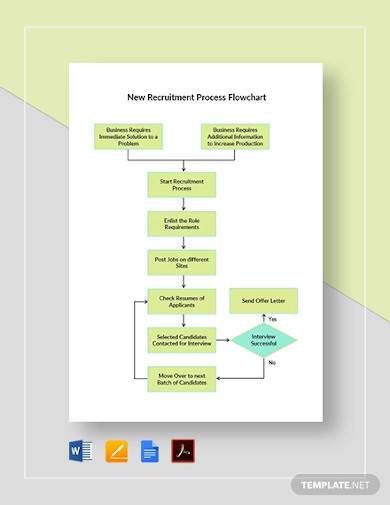
24. New Recruitment Process Flow Chart Template
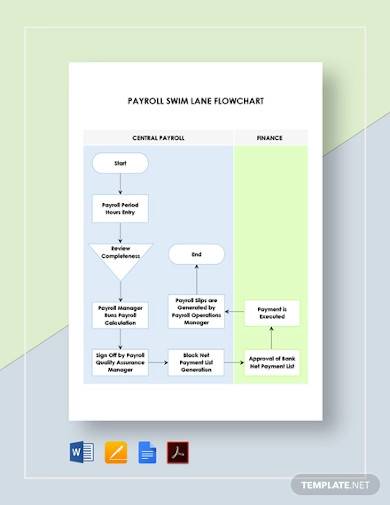
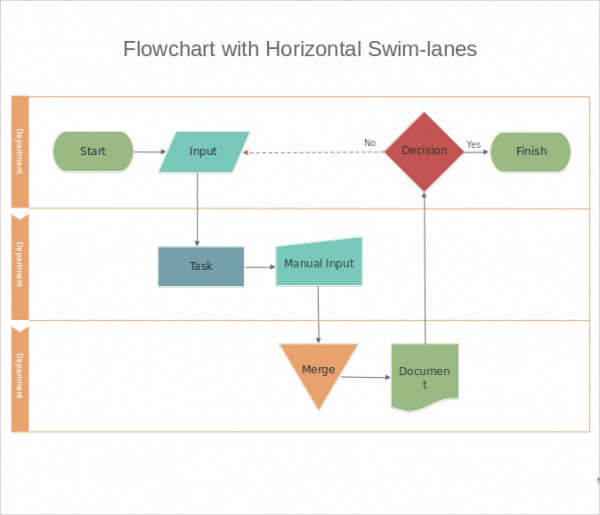
25. Free Payroll Swim Lane Flow Chart Template
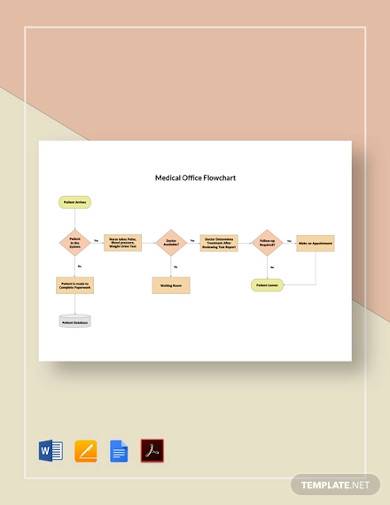
26. Medical Office Flow Chart Template
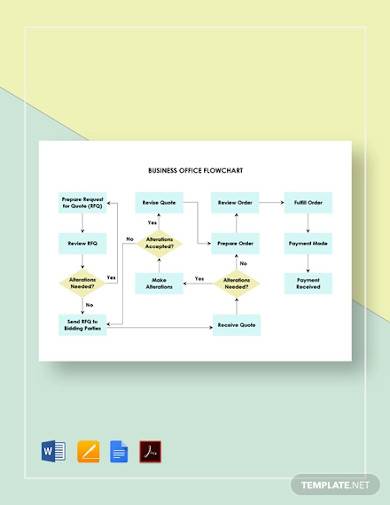
27. Business Office Flow Chart Template
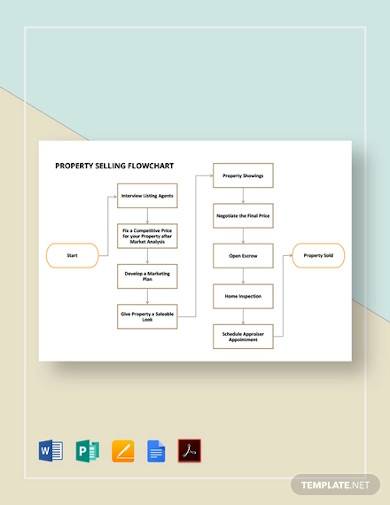
28. Property Selling Flow Chart Template
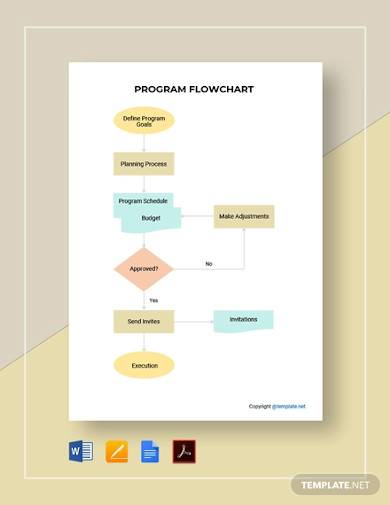
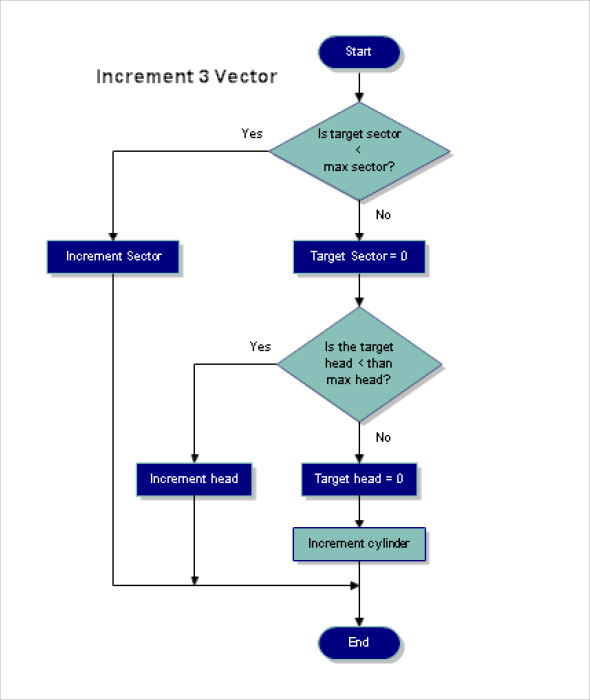
29. Free Basic Program Flow Chart Template
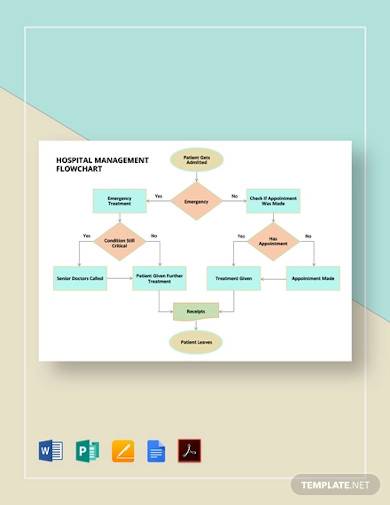
30. Hospital Management Flow Chart Template
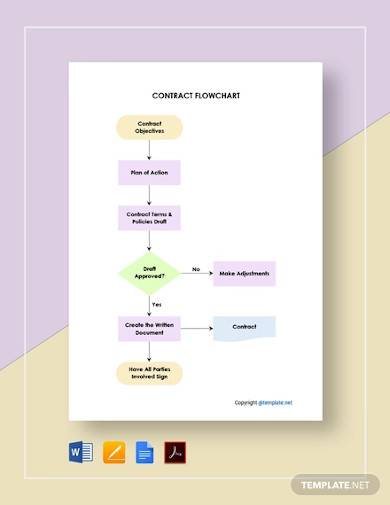
31. Free Simple Contract Flow Chart Template
32. Flow Chart Template in DOC
33. Flow Chart Template in Power Point
34. Sample Flow Chart Excel Template
35. Formal Flow Chart Template
36. Sample Flow Chart Template
37. Process Flow Chart Template
38. System Flow Chart Template
39. Sample Flow Chart Template
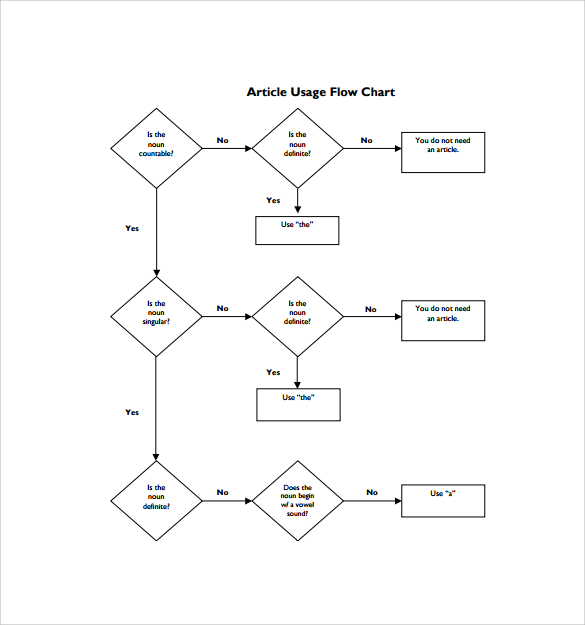
40. Article Usage Flow Chart Template
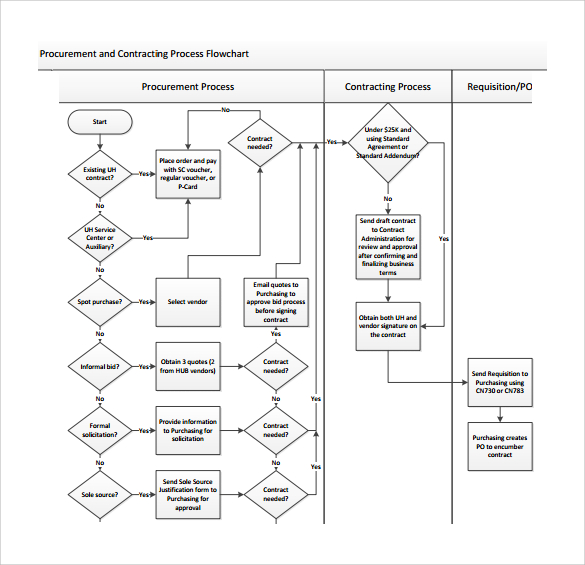
41. Procurement & Contracting Process Flow Chart Template
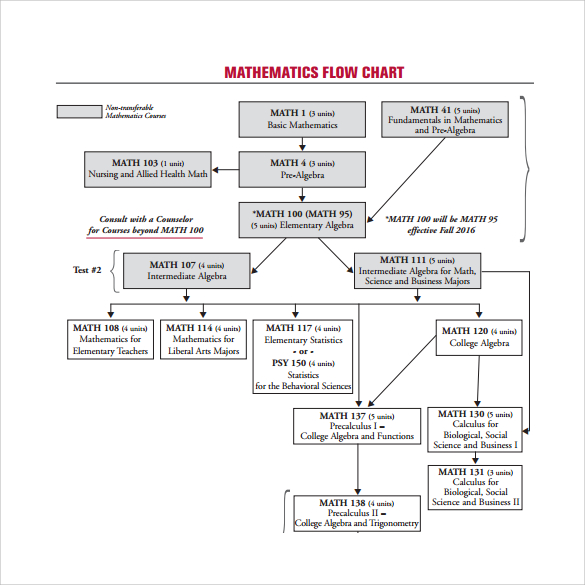
42. Mathematics Flow Chart Template
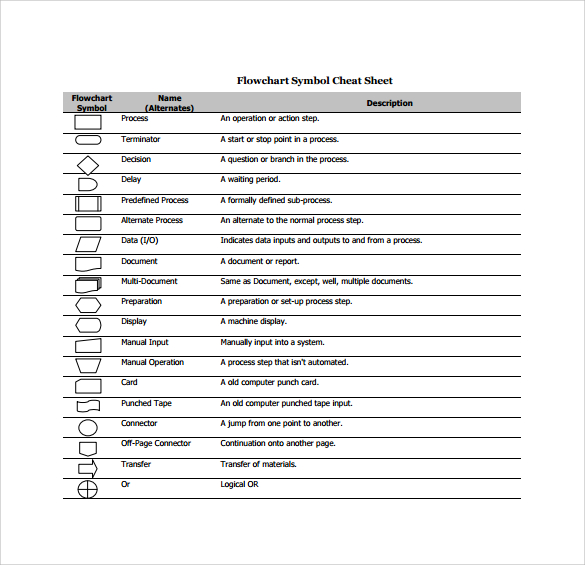
43. Flow Chart Symbol Template
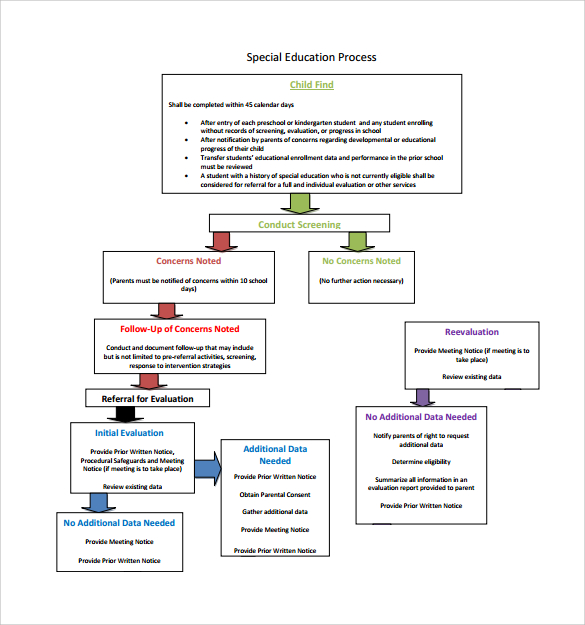
44. Sample Education Process Flow Chart Template
45. Flow Chart Example
46. Simple Flow Chart Template
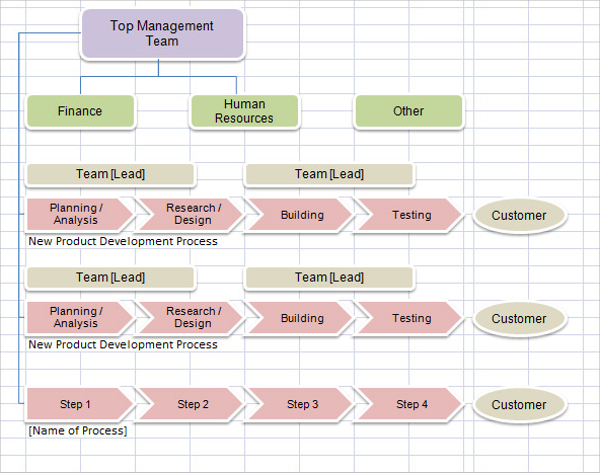
47. Management Team Flow Chart Template
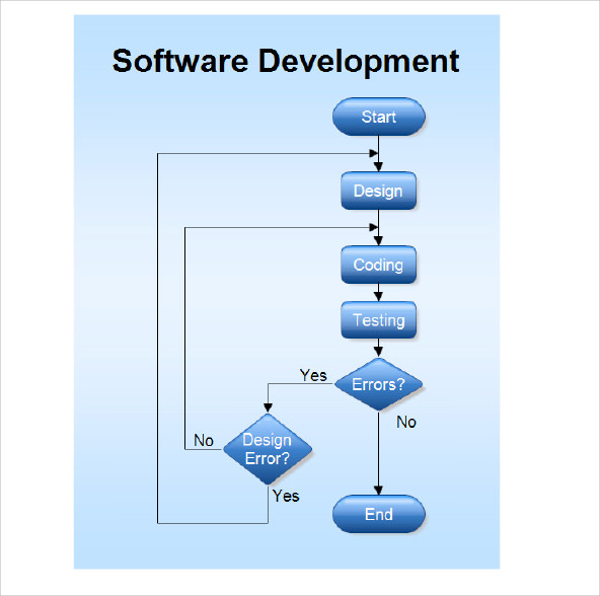
48. Software Development Flow Chart Template
49. Sample Flow Chart Symbols Template
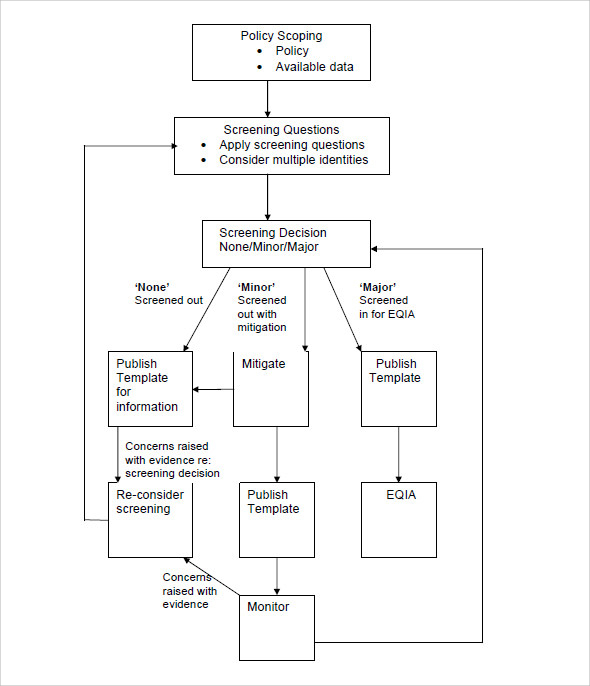
50. Screening Flow Chart Template
51. Basic Flow Chart online Template
What Is a Flowchart?
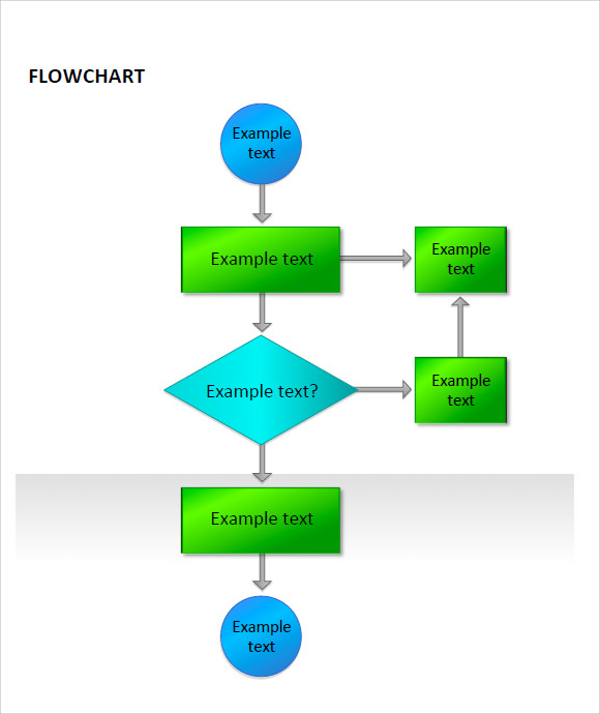
A basic flowchart is a series of lines and shapes representing the steps involved in the completion of a particular project work. This material makes it easier for the viewers or readers to comprehend a systematic procedure since the flowchart symbols set forth a clear direction. Moreover, a business process flowchart helps team leaders convey to their members the correct order of tasks to make sure that they are on the same page in accomplishing a goal.
How to Make a Flowchart
A sample process flowchart is quite easy to make with the help of a flowchart template or an online flowchart creator. However, it is best if you learn how to create a flowchart for yourself or your organization in case study you don’t have the resources previously mentioned. Don’t worry! It will be hassle-free if you follow the steps provided below.
1. Know Your Flowchart
Note that there are different flowcharts design examples that serve different purposes to organizations and individuals. That is why you have to know what information, process, or sample workflow you would like your diagram to depict so that you can determine the right flowchart to create.
2. Be Familiar with the Symbols
Now that you know what type of flowchart to create, the next thing you will do is familiarize the symbols used in its design review. It would not be right to use random shapes in your diagram, for it might confuse the readers. Also, make sure that the shapes and the spaces between them have identical measurements. This way, the end product of your design will be organized.
3. Use Fewer Words
The primary purpose of a flowchart is to simplify the explanation of a complicated process. That said, the diagram would lose its purpose if you write long sentences to expound the concept further. The arrows and shapes should be enough for the viewers to understand the flow of the procedure. Just make sure that you write the appropriate label template for each.
4. Send
Before you present the flowchart to your teammates, see to it that our design will fit into one screen or page. Doing so eliminates confusion on the part of the viewers. It is also crucial to review the content of the chart, for errors might hinder your team in reaching the goal. Lastly, save the file and send it to the people involved in the carrying out of the tasks list.
FAQs
What is the use of a flowchart?
A flowchart is beneficial in various fields because of its capability to provide a solution model for a problem. Aside from helping individuals understand the flow of a process, this material also allows the viewers to have a clear idea of the consequences of their actions as depicted on the material. People also make use of a flowchart in programming, project management, and designing.
What are the basic symbols of a flowchart?
As mentioned beforehand, a flowchart makes use of different symbols. Some of these are:
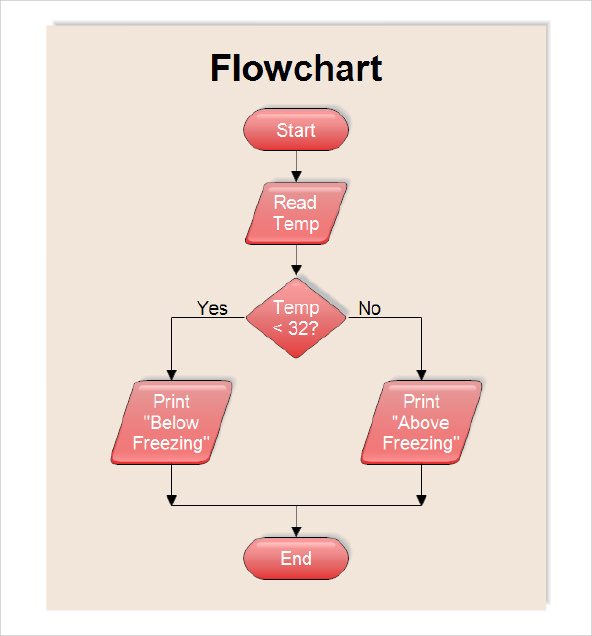
- Oval – represents the start or end of a process
- Rectangle – represents the tasks to accomplish
- Arrows – represents the flow
- Diamond – represents a yes/no decision
What are the three common types of flowchart?
The three common types of flowcharts are process flowchart, data flowchart, and business process modeling flowchart.
One thing that hinders us from accomplishing a particular goal is the complexity of the process leading toward the target. And in some instances, it is exhausting to explain the procedures to your team over and over again. During these times, the best action to take is to illustrate the process using a flowchart. This way, your team can be more efficient in working towards a specific goal list. You can either create a flowchart from scratch, which may take a lot of time or make use of our templates and sample documents so you can finish your design in an instant.
Related Posts
Sample Meeting Minutes Templates
Presentation Speech Samples & Templates
Ukulele Chord Chart Samples & Templates
Retirement Speech Samples & Templates
Weekly Schedule Samples & Templates
Contractual Agreement Samples & Templates
FREE 9+ Amazing Sample Church Bulletin Templates in PSD | PDF
Sample Business Card Templates
Sample Cashier Job Descriptions
Questionnaire Samples
FREE 10+ Sample HR Resource Templates in PDF
FREE 10+ HR Consulting Business Plan Samples in MS Word | Google Docs | Pages | PDF
FREE 49+ Sample Job Descriptions in PDF | MS Word
FREE 16+ Nonprofit Budget Samples in PDF | MS Word | Excel | Google Docs | Google Sheets | Numbers | Pages
FREE 13+ Academic Calendar Templates in Google Docs | MS Word | Pages | PDF