
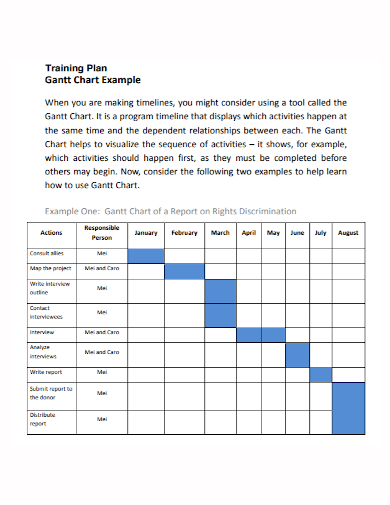
Use the vertical axis to display the tasks that must be accomplished, and the horizontal axis to illustrate a timeline to construct a Gantt chart. As you enter tasks, their start dates, finish dates, and dependencies, bars on the stacked bar chart representing task durations will populate. If you use a project management program with a Gantt chart builder, this works automatically. The majority of Gantt diagrams are made in Excel or with project management software, commonly known as Gantt chart software. If you use Gantt chart software instead of an Excel Gantt chart template to create Gantt charts, you’ll be capable to do more than just observe task durations and due dates.
Use the vertical axis to display the tasks that must be accomplished, and the horizontal axis to illustrate a timeline to construct a Gantt chart. As you enter tasks, their start dates, finish dates, and dependencies, bars on the stacked bar chart representing task durations will populate. If you use a project management program with a Gantt chart builder, this works automatically. The majority of Gantt diagrams are made in Excel or with project management software, commonly known as Gantt chart software. If you use Gantt chart software instead of an Excel Gantt chart template to create Gantt charts, you’ll be capable to do more than just observe task durations and due dates.
10+ Training Plan Gantt Chart Samples
You must consider all of the tasks involved in your project while creating a Gantt chart. You’ll figure out who will be in charge of each task, how long each activity will take, and what challenges your team might face as part of this process. Before you begin, you may use this deep thought to ensure that the schedule is manageable, that the correct personnel are assigned to each task, and that you have remedies for any potential problems. They can also assist you in determining practical aspects of a project, such as how long it will take to finish and which tasks must be accomplished before others can begin.
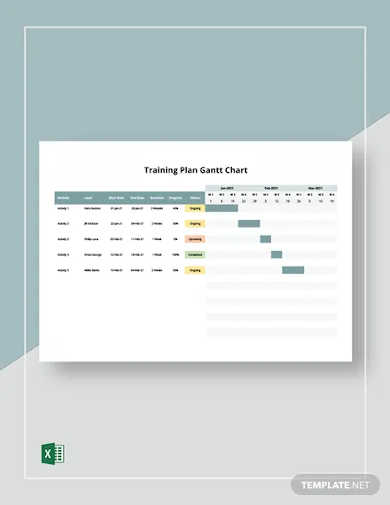
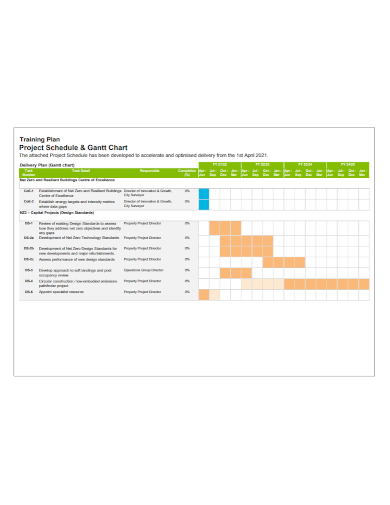
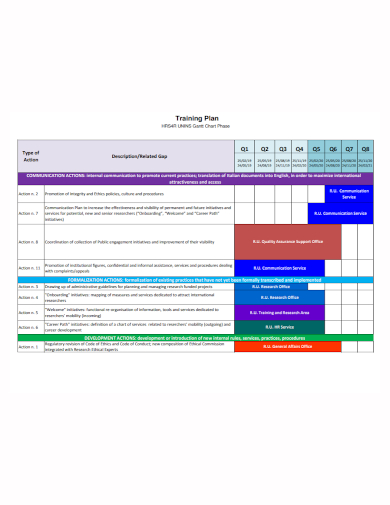
1. Training Plan Gantt Chart Template
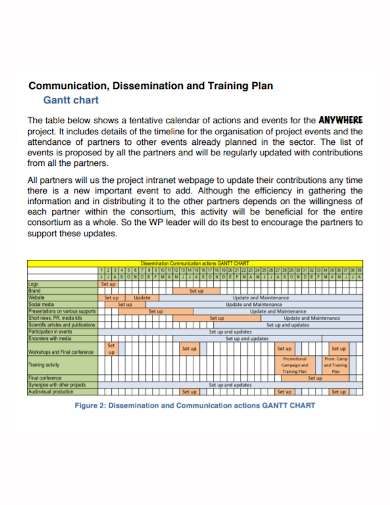
2. Communication Training Plan Gantt Chart
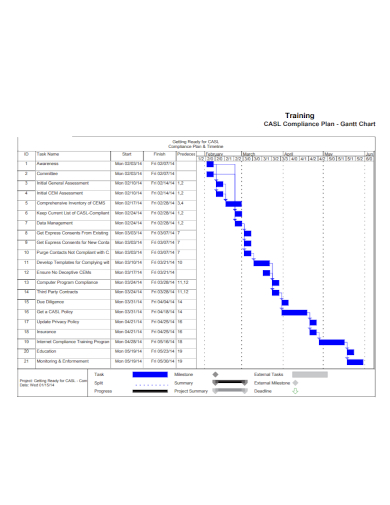
3. Training Compliance Plan Gantt Chart
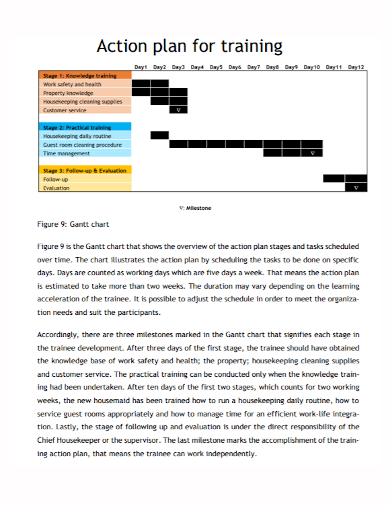
4. Training Action Plan Gantt Chart
5. Project Training Plan Gantt Chart
6. Sample Training Plan Gantt Chart
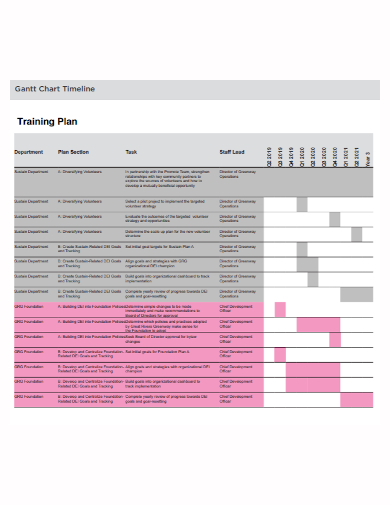
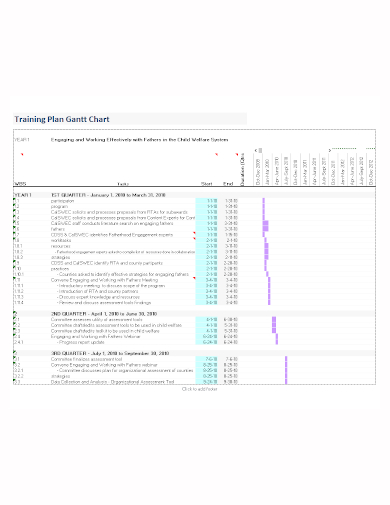
7. Training Plan Gantt Chart Timeline
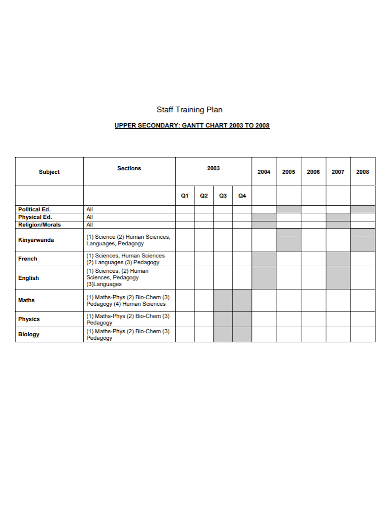
8. Staff Training Plan Gantt Chart
9. Training Plan Phase Gantt Chart
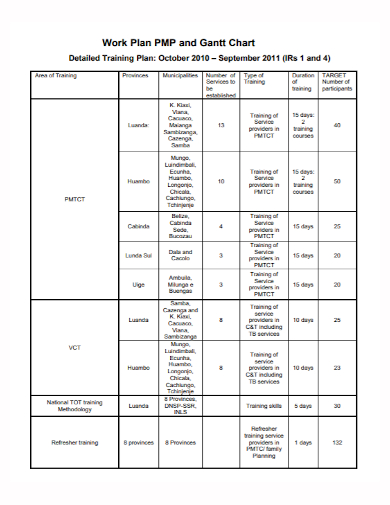
10. Training Work Plan Gantt Chart
11. Editable Training Plan Gantt Chart
How it Works
Your Gantt chart advantage begins with a basic understanding of the elements required to make it operate.
When looking at several versions of the chart and using software, you’ll notice that there are a lot of symbols, arrows, and other useful tools you can use to develop the flow in the chart. However, we’ll focus on the conceptual elements that make project management possible in this article.
- Dates and timeline – The manner the Gantt chart uses its calendar to put that idea in perspective is by far the most valuable feature. Professionals can gain a visual sense of what needs to be done and on what days by categorizing it by day. The calendar works like a flowing timesheet, with each project phase tracked based on the expected number of days it will take to finish.
- Tasks – The calendar will be used to organize each task. When you enter each crucial phase and piece, the Gantt chart advantage allows you to see everything in one location and estimate how long it will take to complete.
- Bars – The bars are one of the most recognizable aspects of the Gantt chart. Each bar represents a task that will take a certain number of days to complete. Each day is identified, and the bars indicate that one task will be completed on Tuesday and Wednesday, for example.
- Arrows and dependencies – Not all tasks are black-and-white. Some tasks must be accomplished simultaneously or prior to the start of the next. It is feasible to plan a successful strategy using arrows and inputs that incorporate dependencies.
- Tracking – The ability to track a project’s progress is critical to its success. The state of a task is indicated by shading on a Gantt chart. When combined with the dates and timeline tool, managers can see the big picture and determine whether they’re on track.
- Milestones – These are the major milestones, or benchmarks, that indicate if a project is on track. The Gantt chart uses diamonds or similar symbols to indicate the importance of these tasks in the project’s overall health. A project may be completed by a series of little tasks, but the milestone is the satisfying line that every professional aspires to cross.
- Responsible team members – A smart manager understands that if a single person isn’t held accountable, nothing gets done. Professionals can use the Gantt chart to indicate who will complete the assignment and other pertinent information.
FAQs
What are the benefits of creating an online Gantt chart software?
When you want to communicate your project timetable with a larger group of individuals, creating a Gantt chart online is considerably easier. Tasks are updated in real time if someone updates their percent complete, makes a comment, or attachments a file. You may also drag and drop project tasks as a project manager to make real-time adjustments to the project schedule.
What benefit can we get from a Gantt chart?
The project can be visualized. The overwhelming sensation of being able to achieve your goal is one of the most difficult aspects of a significant project. Many small steps accumulate to have very profound implications. A large project becomes achievable if you can see everything in one location, aesthetically arranged.
If you want to see more samples and formats, check out some training plan Gantt chart samples and templates provided in the article for your reference.
Related Posts
FREE 10+ Medicine Chart Samples in PDF | MS Word
FREE 10+ Seat Chart Samples in PDF
FREE 10+ Pie Chart Samples in PDF
Free 3+ Eye Color Chart Samples in PDF
FREE 10+ Family Chore Chart Samples in PDF
FREE 10+ Classroom Chart Samples in PDF
FREE 10+ Genealogy Chart Samples in PDF
FREE 10+ Shipping Chart Samples in PDF
FREE 10+ Goal Chart Samples in PDF
FREE 10+ Character Chart Samples in PDF
FREE 10+ Table Seating Chart Samples in PDF
FREE 10+ Classroom Seating Chart Samples in PDF
FREE 10+ Grade Chart Samples in PDF
FREE 10+ Workflow Chart Samples in PDF
FREE 10+ Budget Chart Samples in PDF